Concept summary
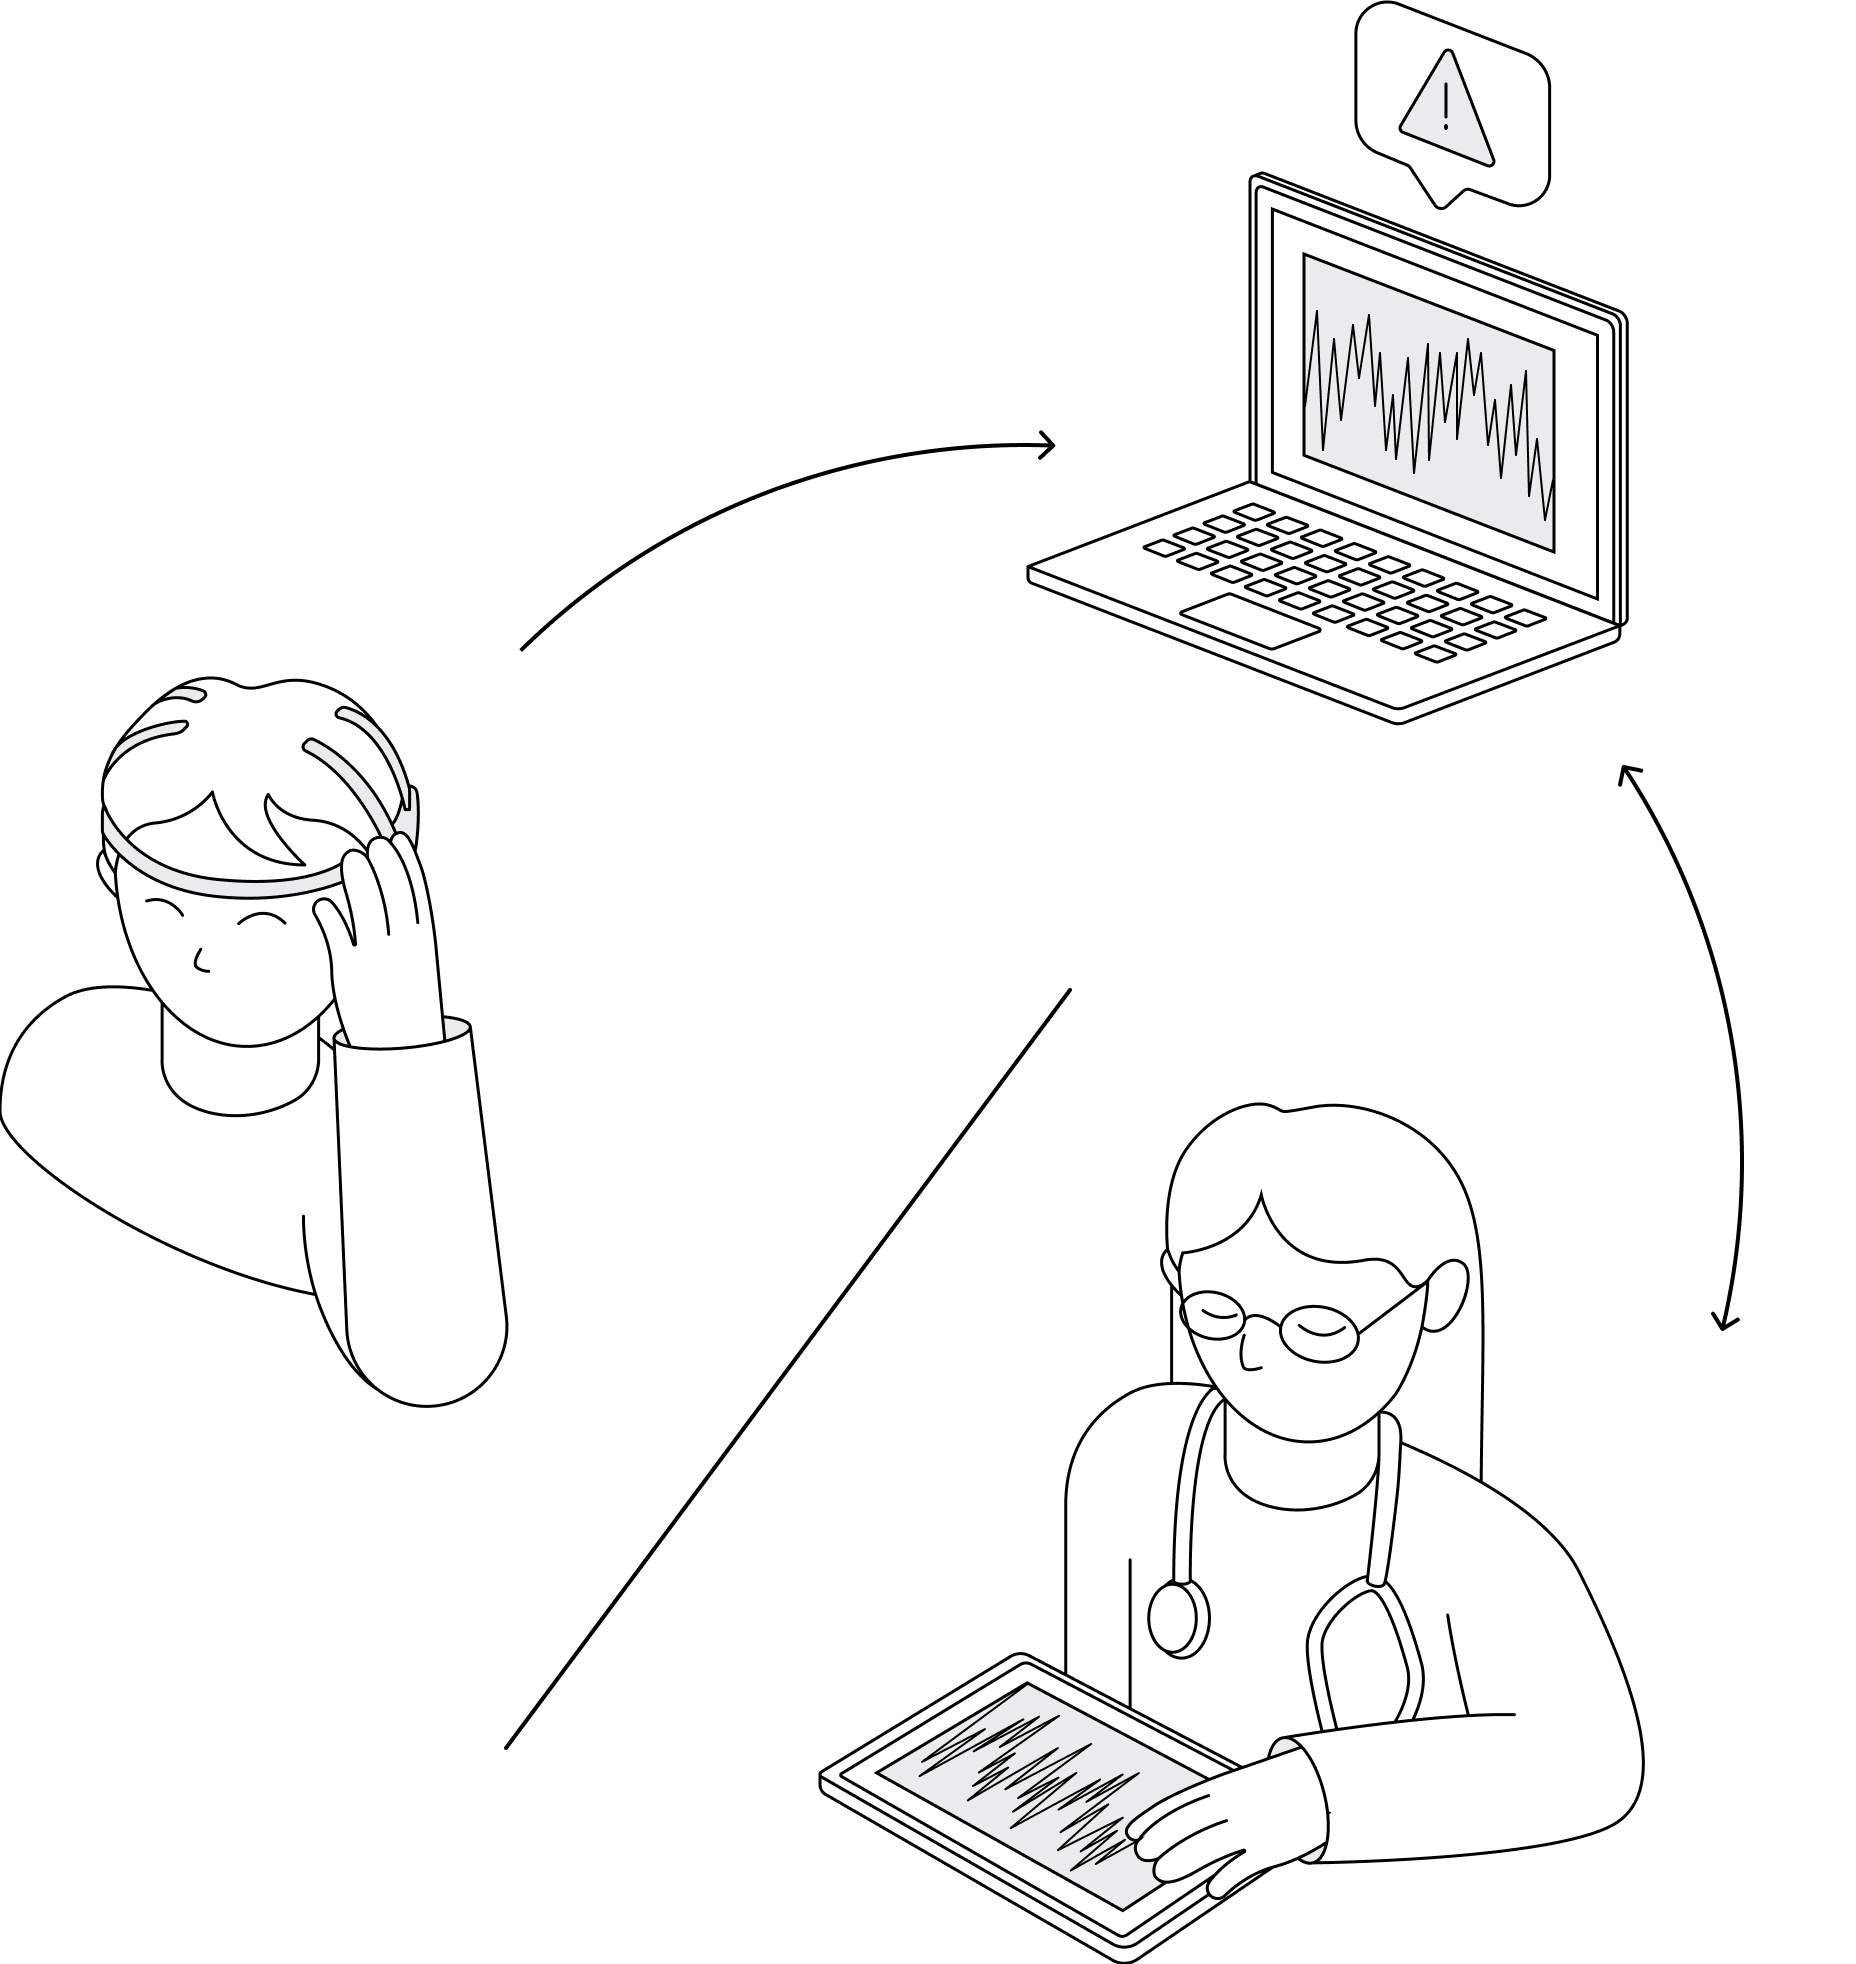
Epilepsy is diagnosed and treated with the help of an electroencephalogram (EEG). Small sensors attached to the scalp are used to record brain activity. This procedure usually takes place in clinical stays over several hours or even days. Bridge aims to reduce clinical stays to a minimum by allowing remote EEG recordings from home. Time-consuming processes such as the evaluation of EEG-recordings are taken over by the software, reducing the workload of medical professionals.
Research
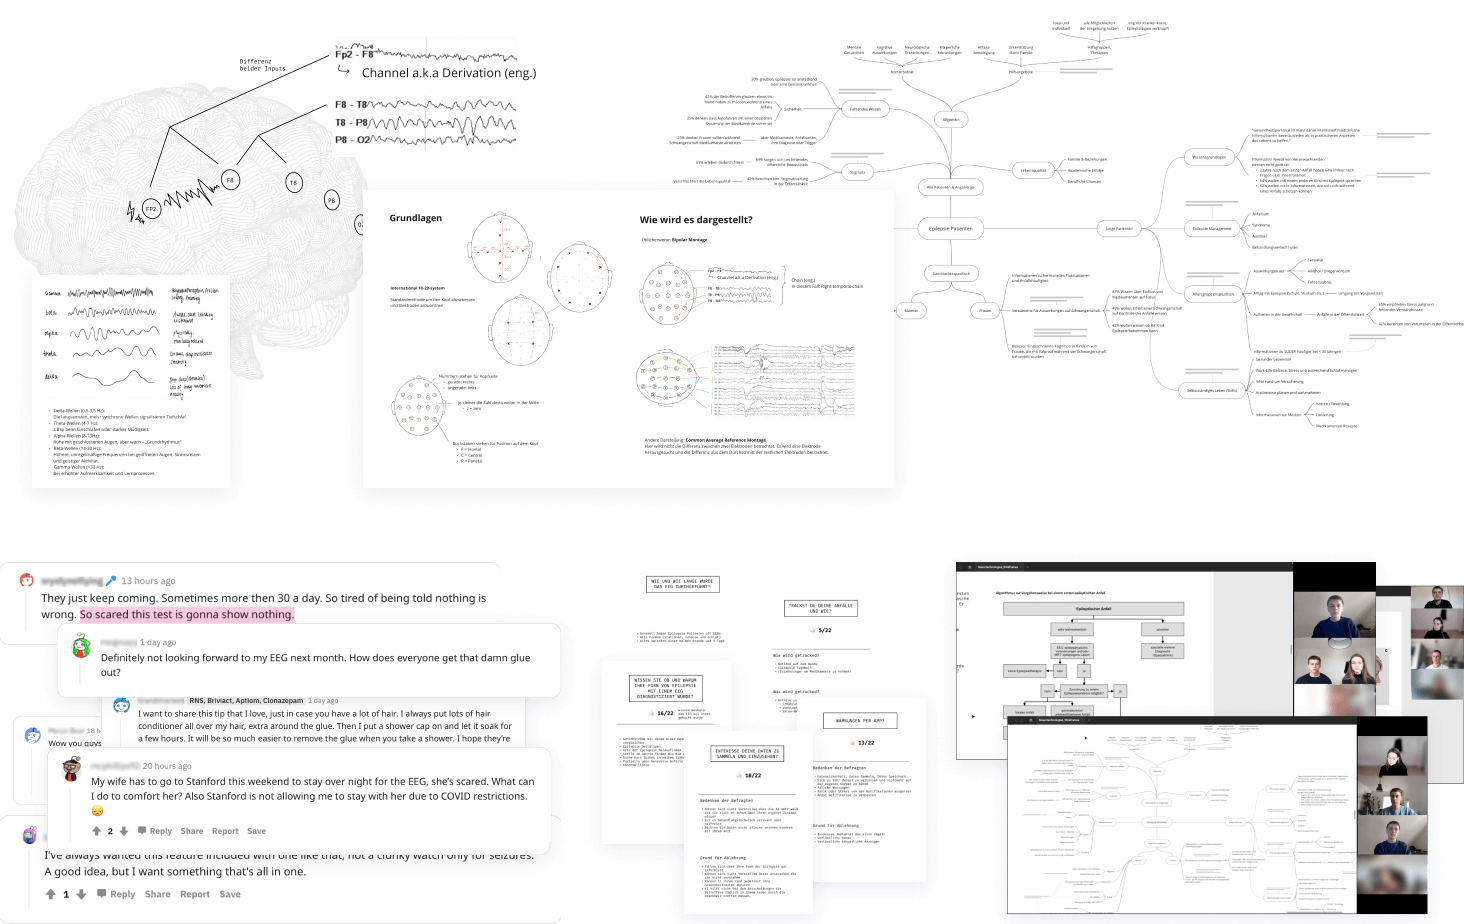
In addition to research we talked to various experts in the field of neurotechnologies. In doing so, we were able to get a better understanding of the requirements and current problems with EEG hardware and software. To better adapt the application to the problems and needs of those affected, we contacted epilepsy patients via an online forum.
Target group challenges
- Diminished quality of life due to high risk of injury, limited independence, and public stigma
- Often long hospital stays, uncomfortable electrode setup, lack of privacy
- No uniform tool to track and determine disease-specific correlations
Ideation
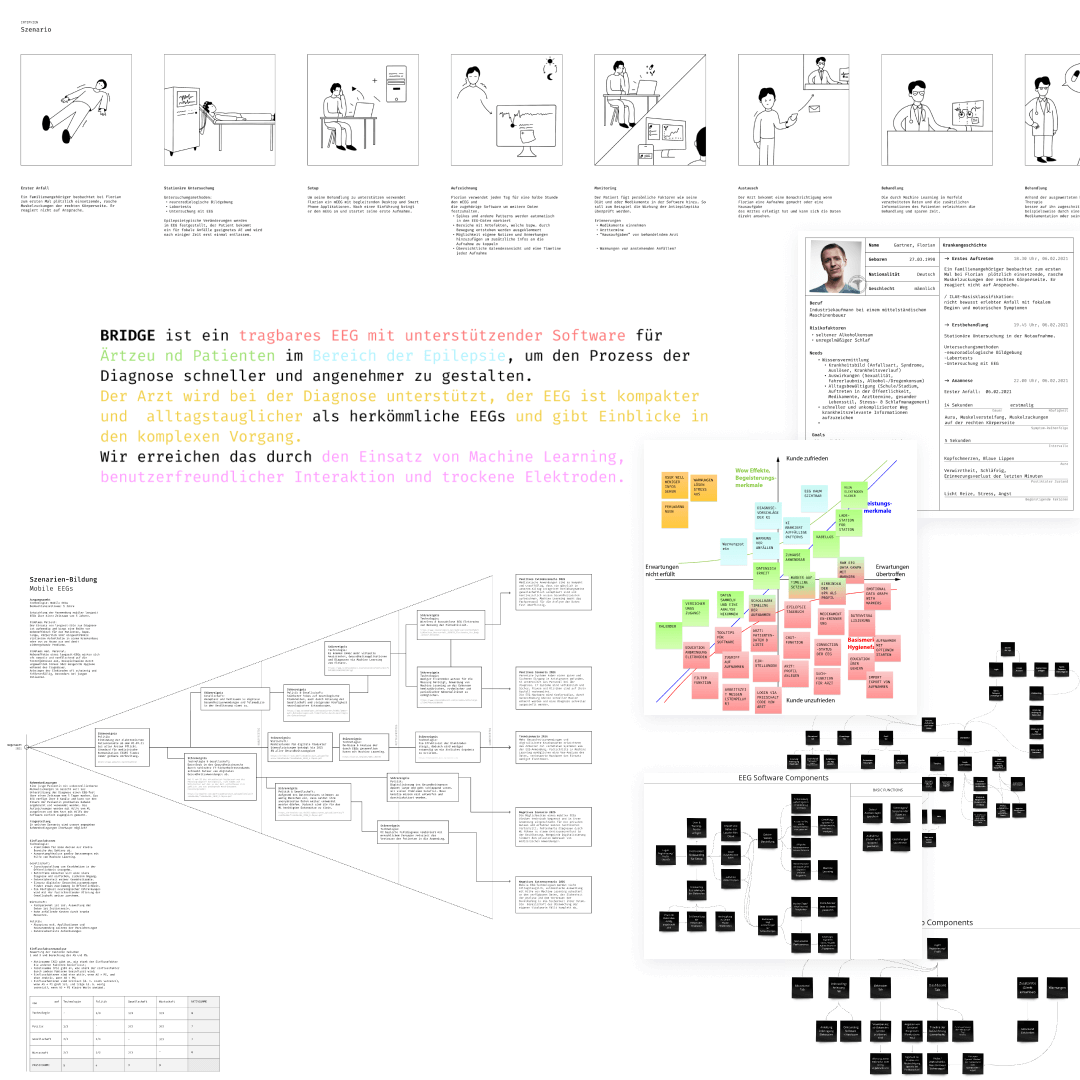
By talking directly to people with epilepsy, we were able to validate our approaches in order to further elaborate or discard specific functions. Once we had a better idea of the users' needs, we created personas and customized storyboards. We then adapted our concept to meet these requirements and defined principles for the application.
Project goals
- Universal handling of hardware and software - Including patients with poor access to clinics (developing countries)
- Quick and assisted tracking of data
- Present data in a accessible, comprehensible way
- Facilitate communication among patients and medical staff
Design System
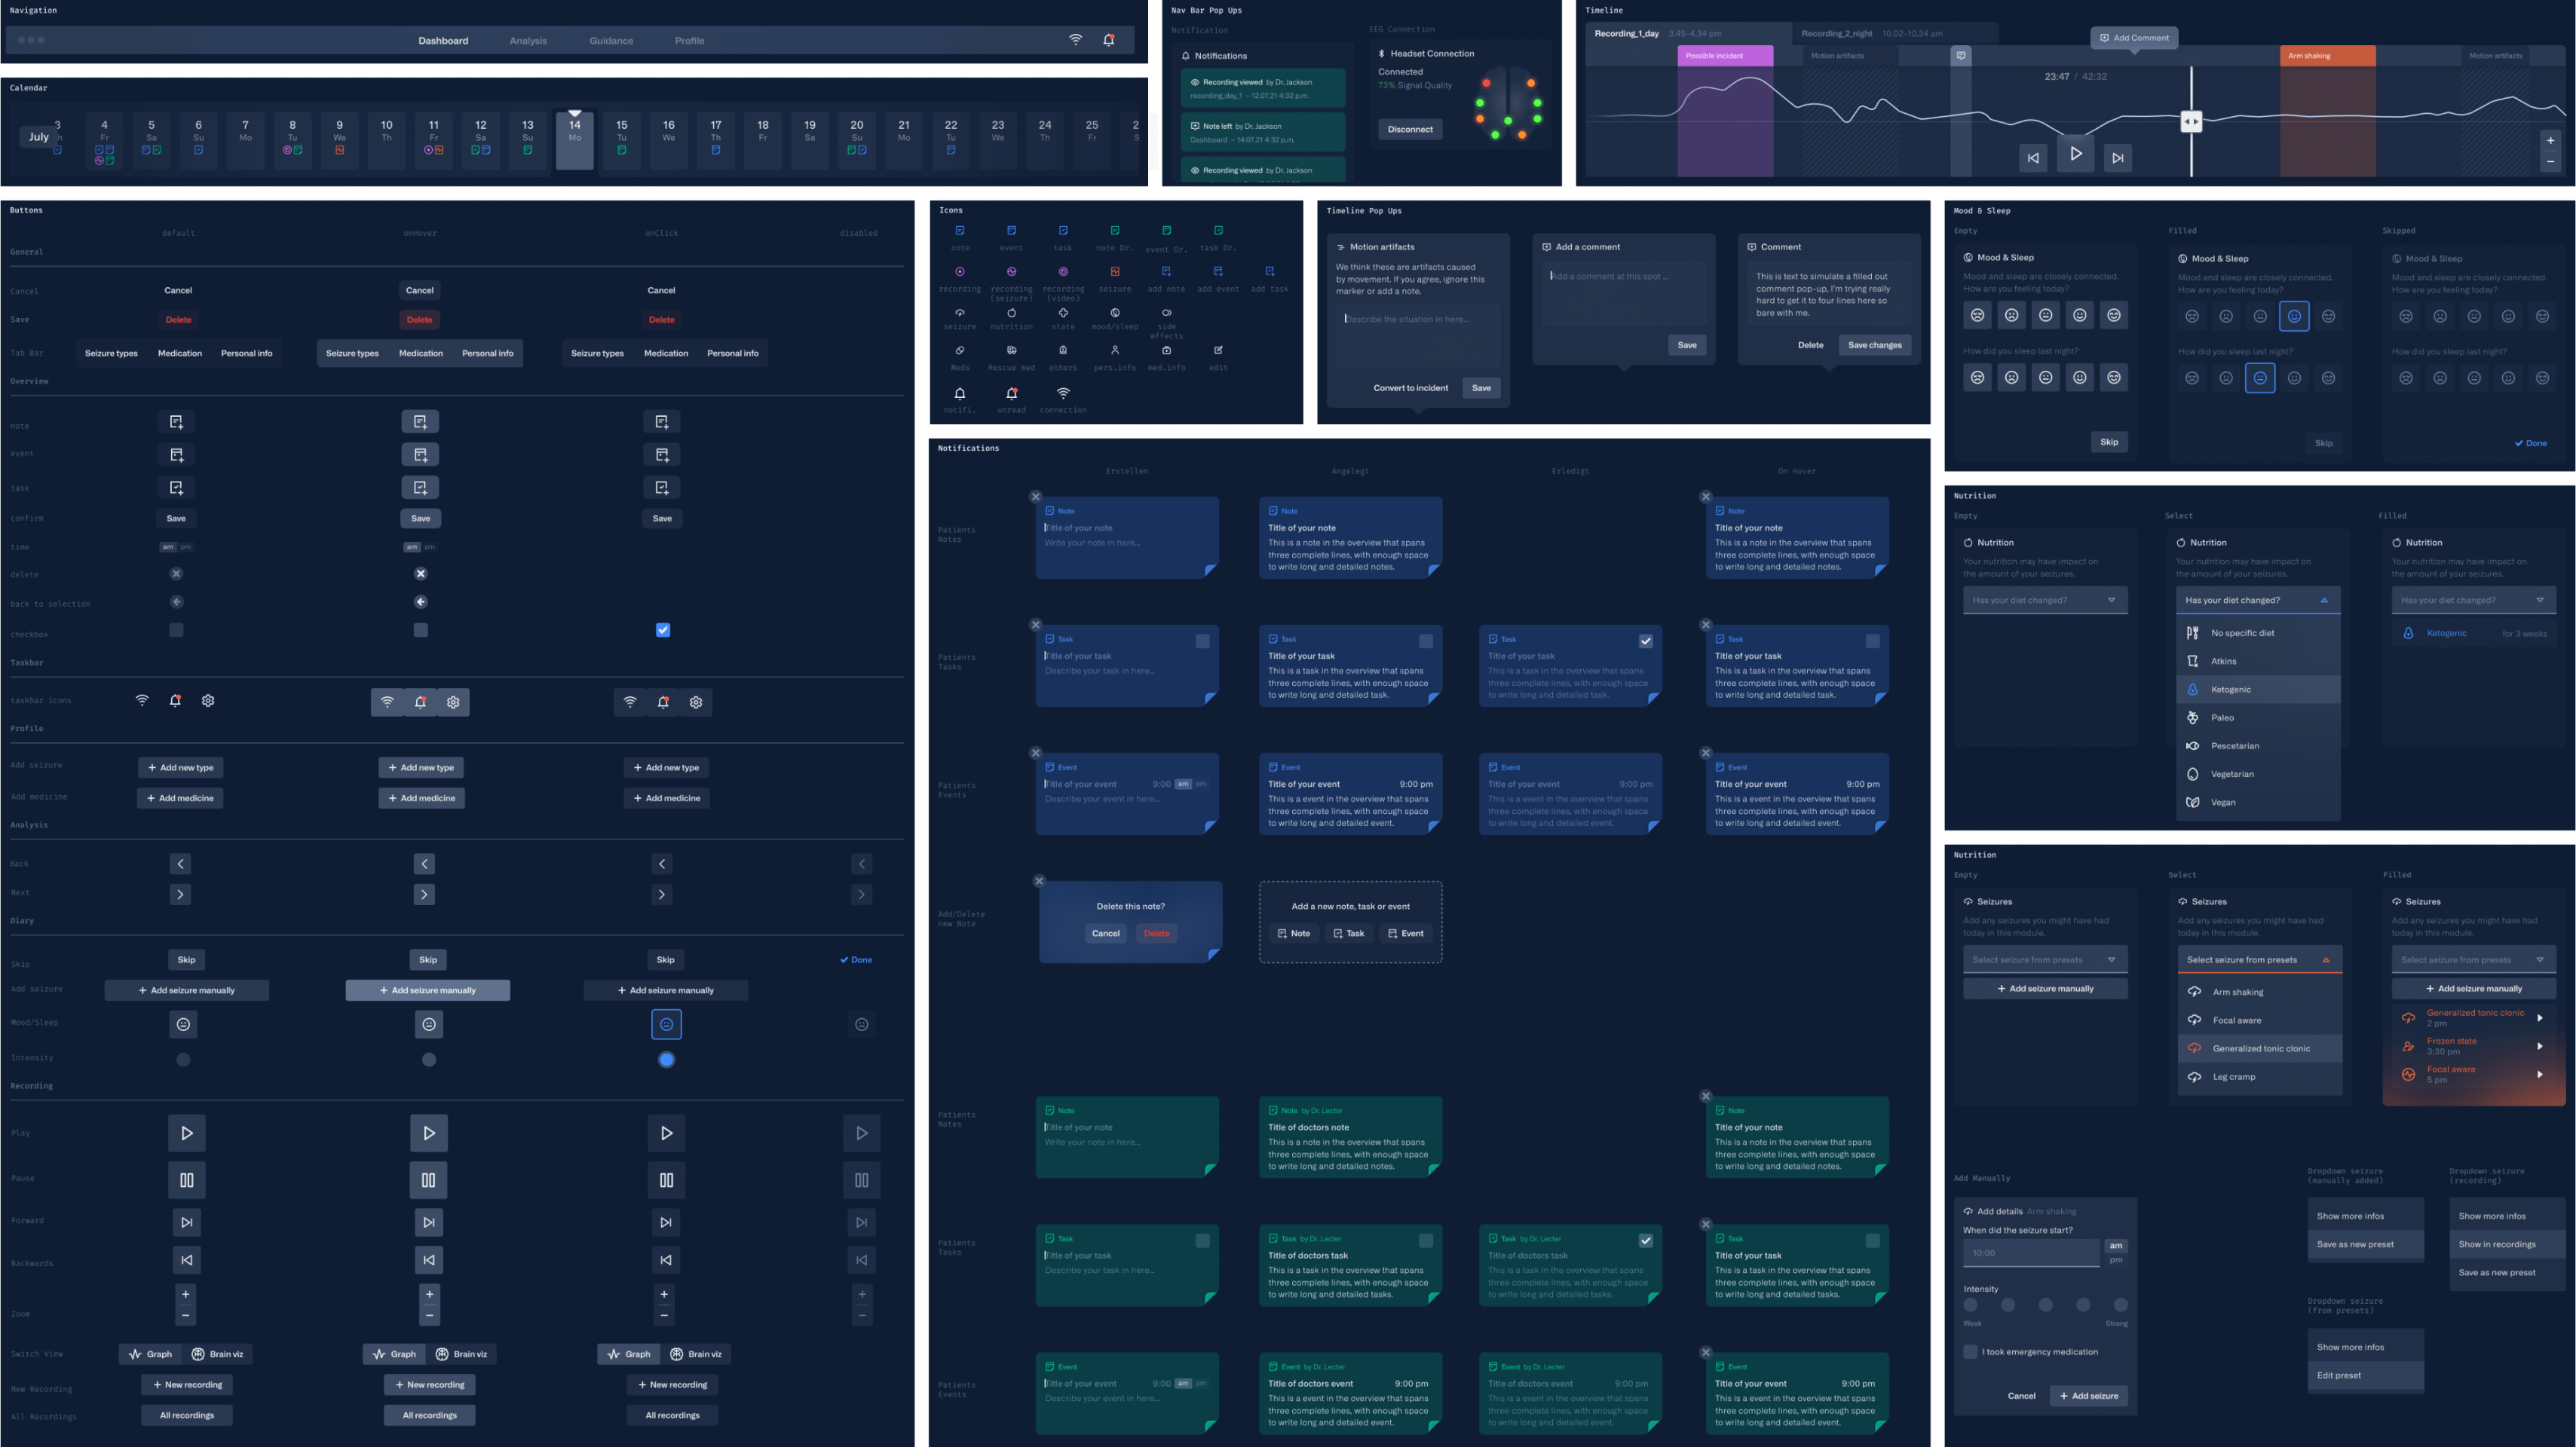
Since bridge is used in a telemedicine context, we aimed for the appearance to be serious and trustworthy but also friendly. Since some elements appear more frequently on the interface and in order to better illustrate their connection, we color-coded them. Another reason to keep the rest of the interface simple.
Hardware
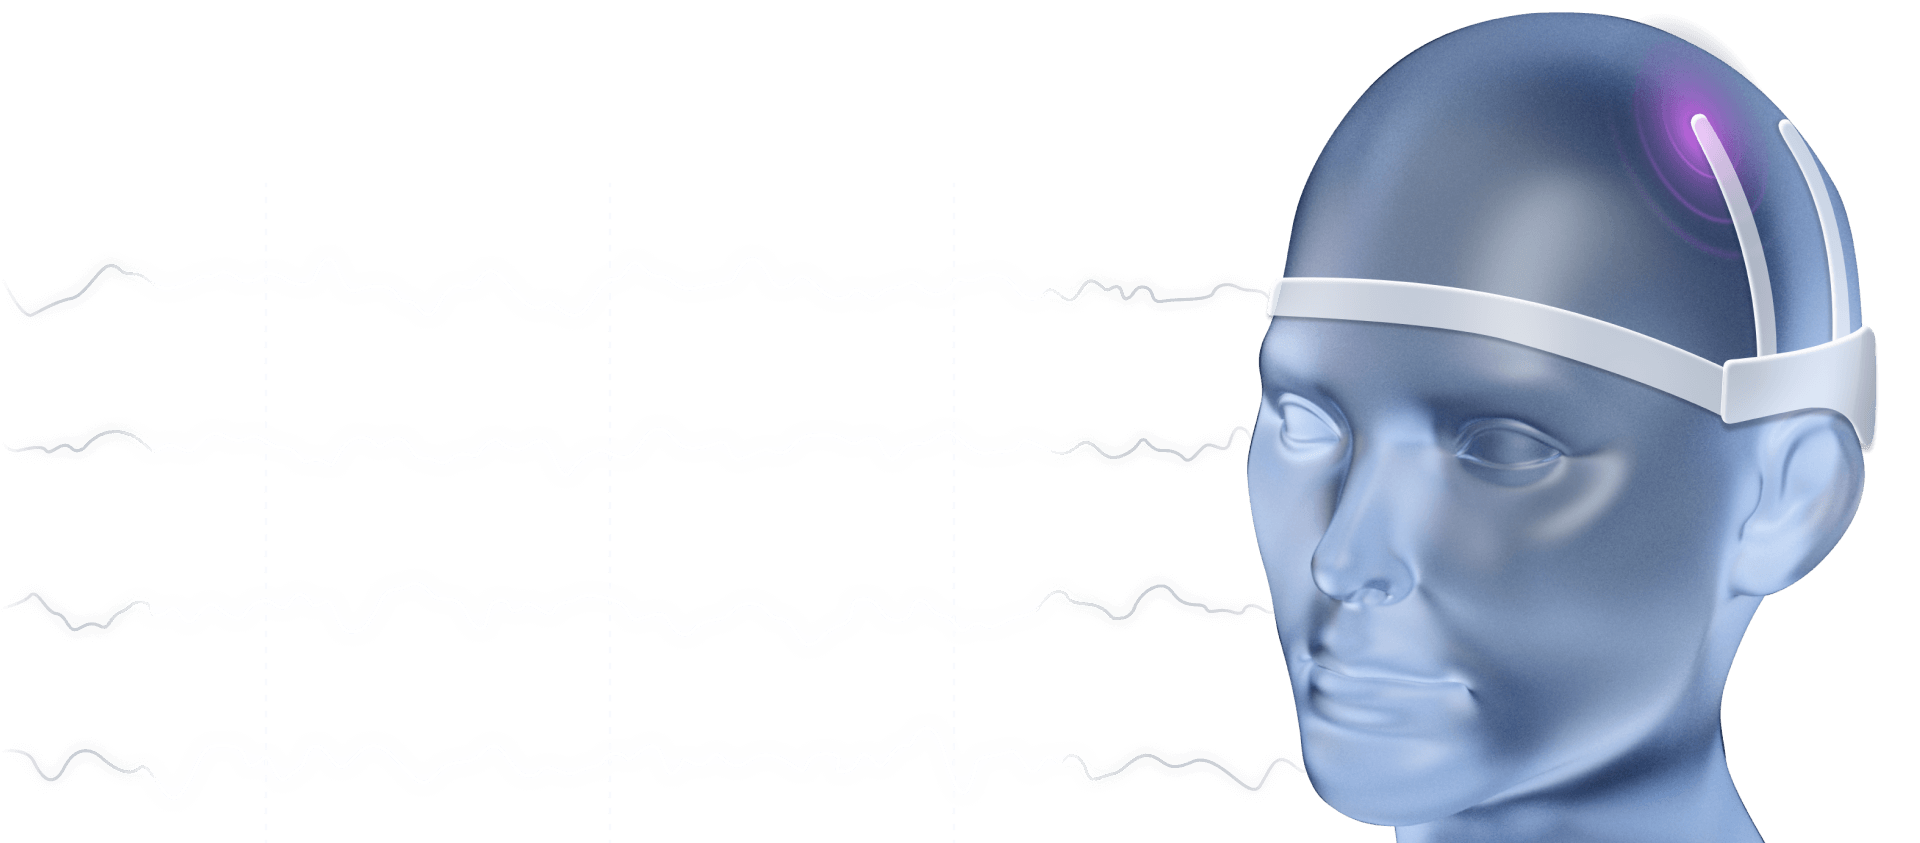
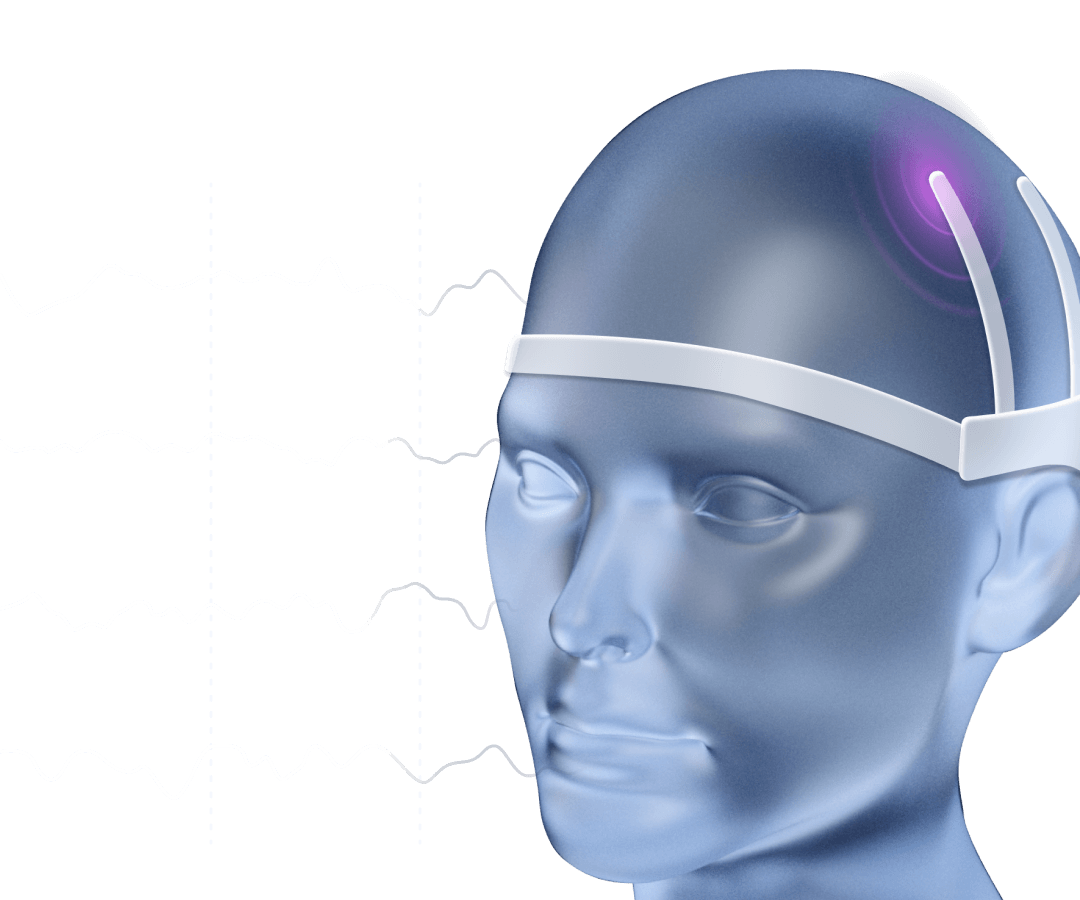
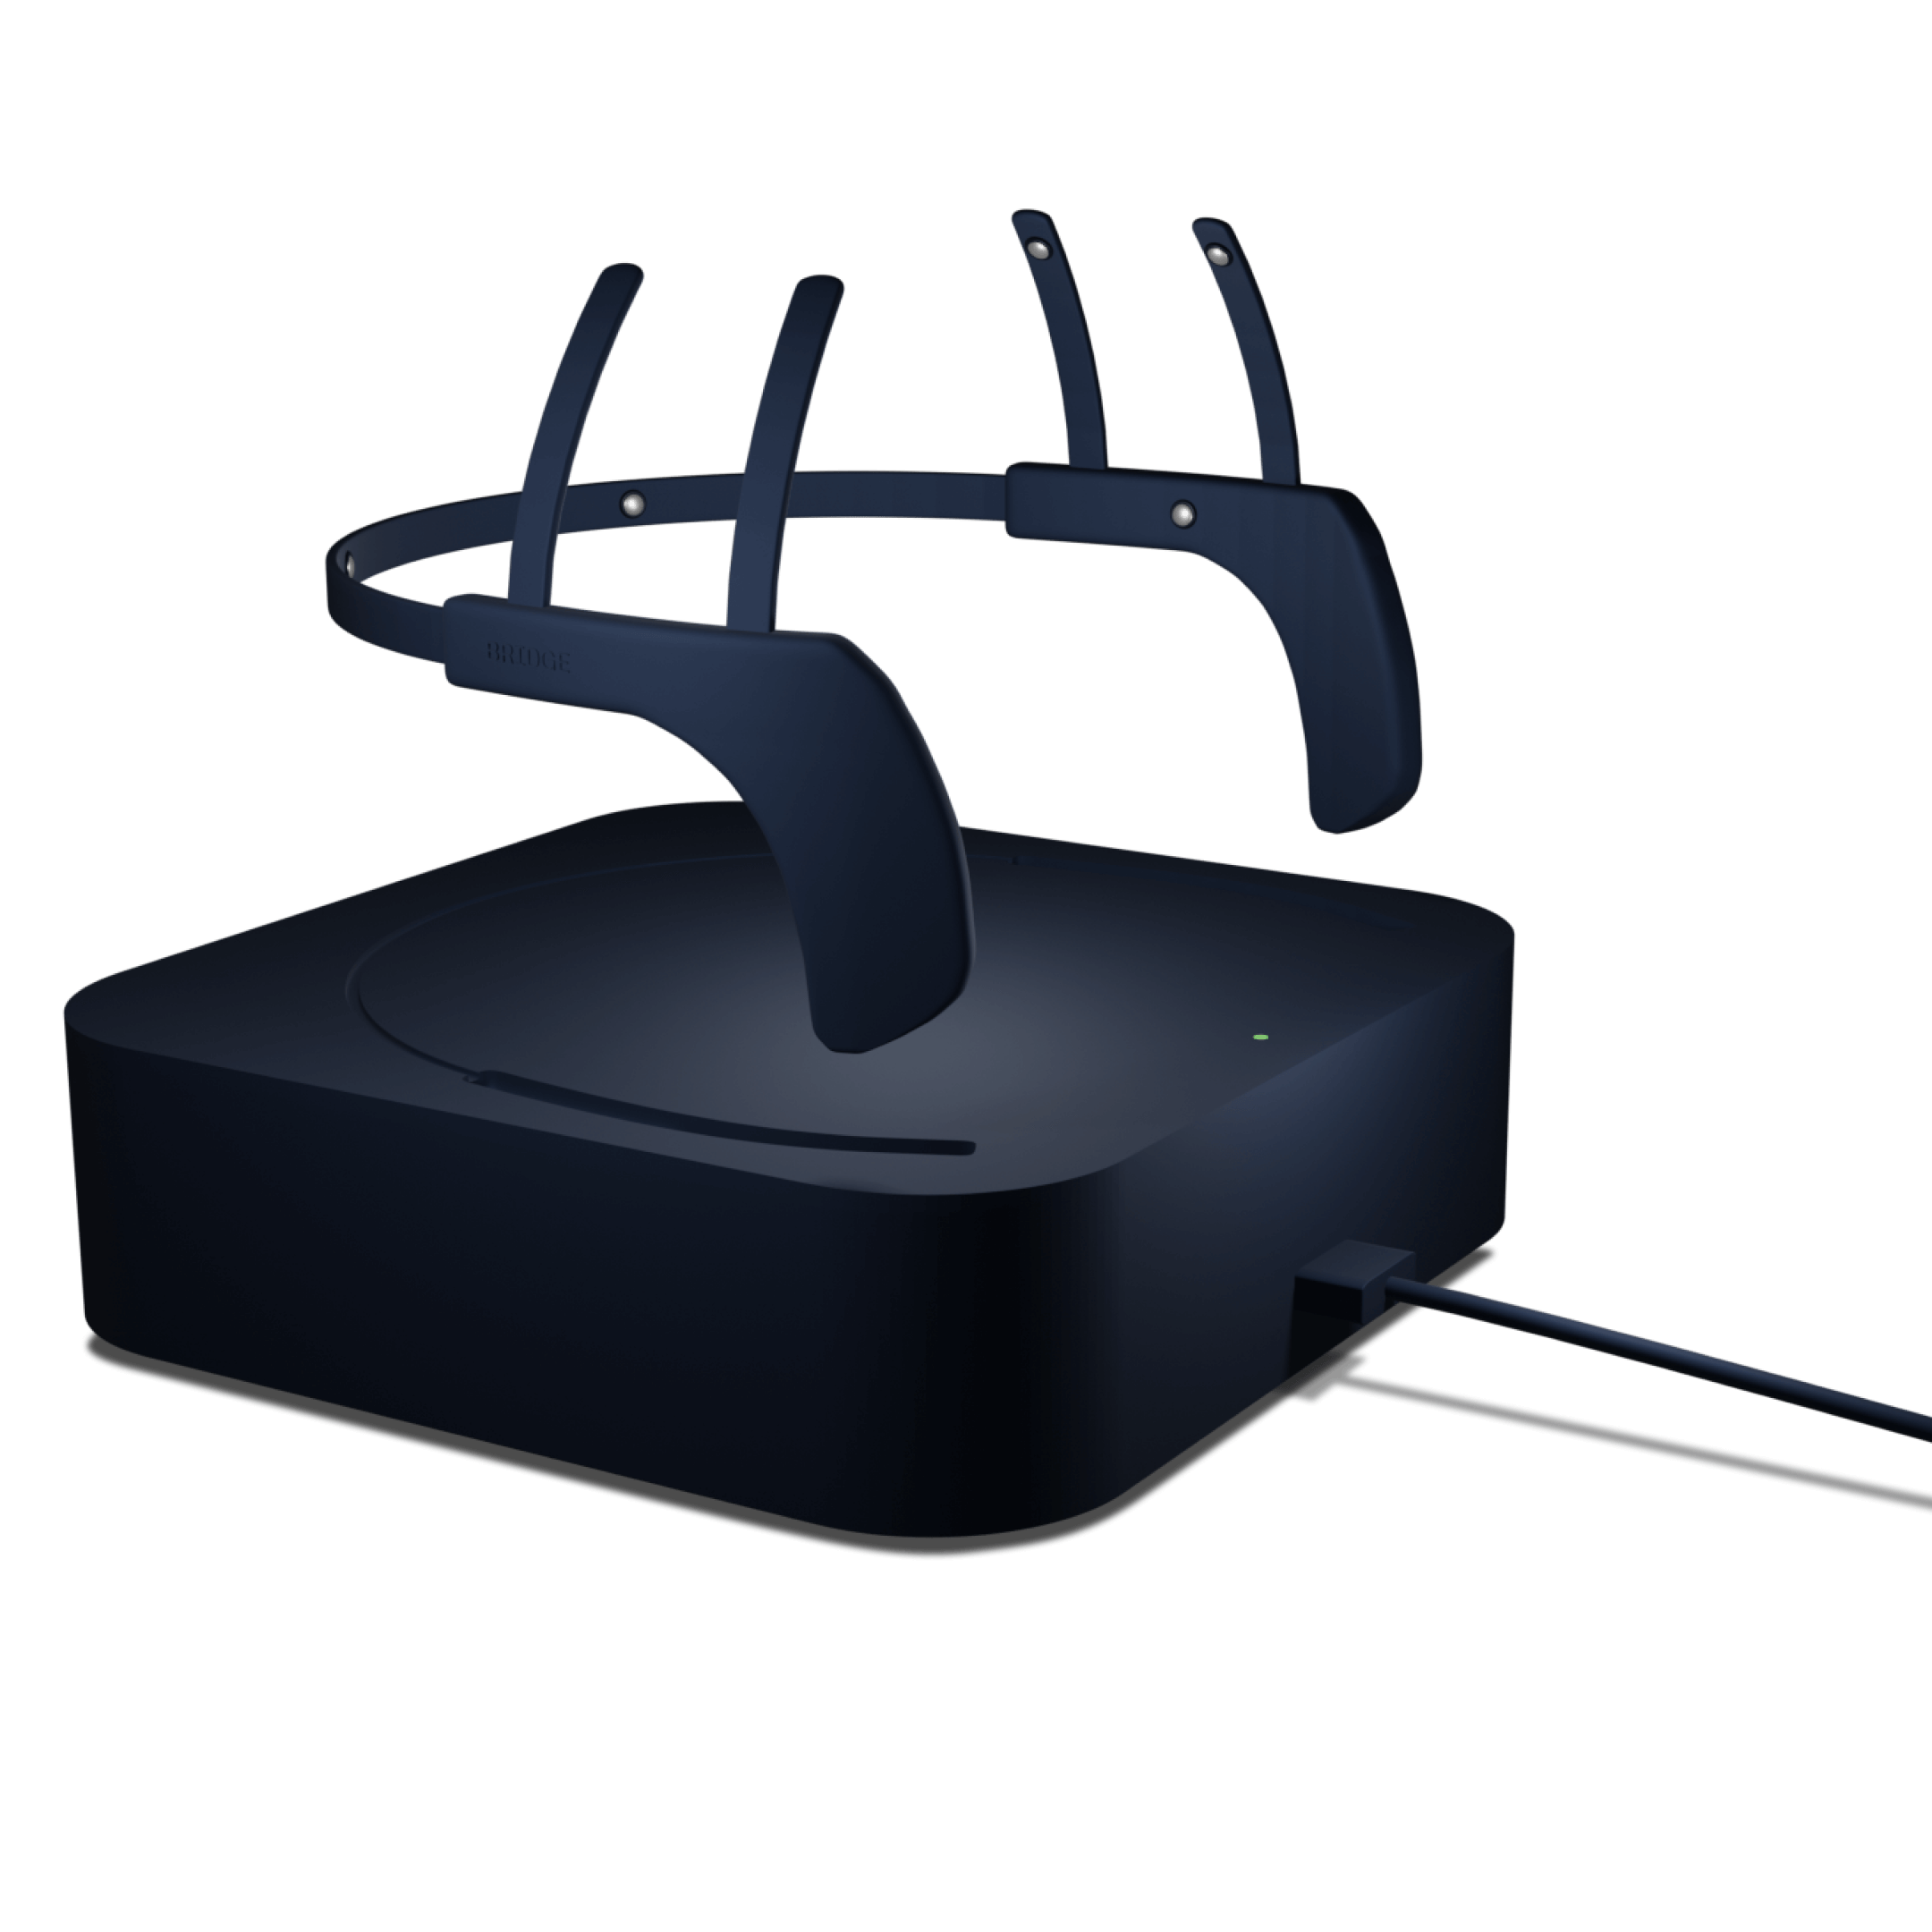
In addition to the software, we developed a prototype of the mobile eeg in Blender. Following requirements had to be met: Easy to use and attach, no interfering with everyday life and discreet appearance. Since the technology is not yet advanced enough, these requirements cannot be met. However, many experts we talked to were confident that our scenario will become more and more of a reality, which is why we stuck to our concept.
Dashboard
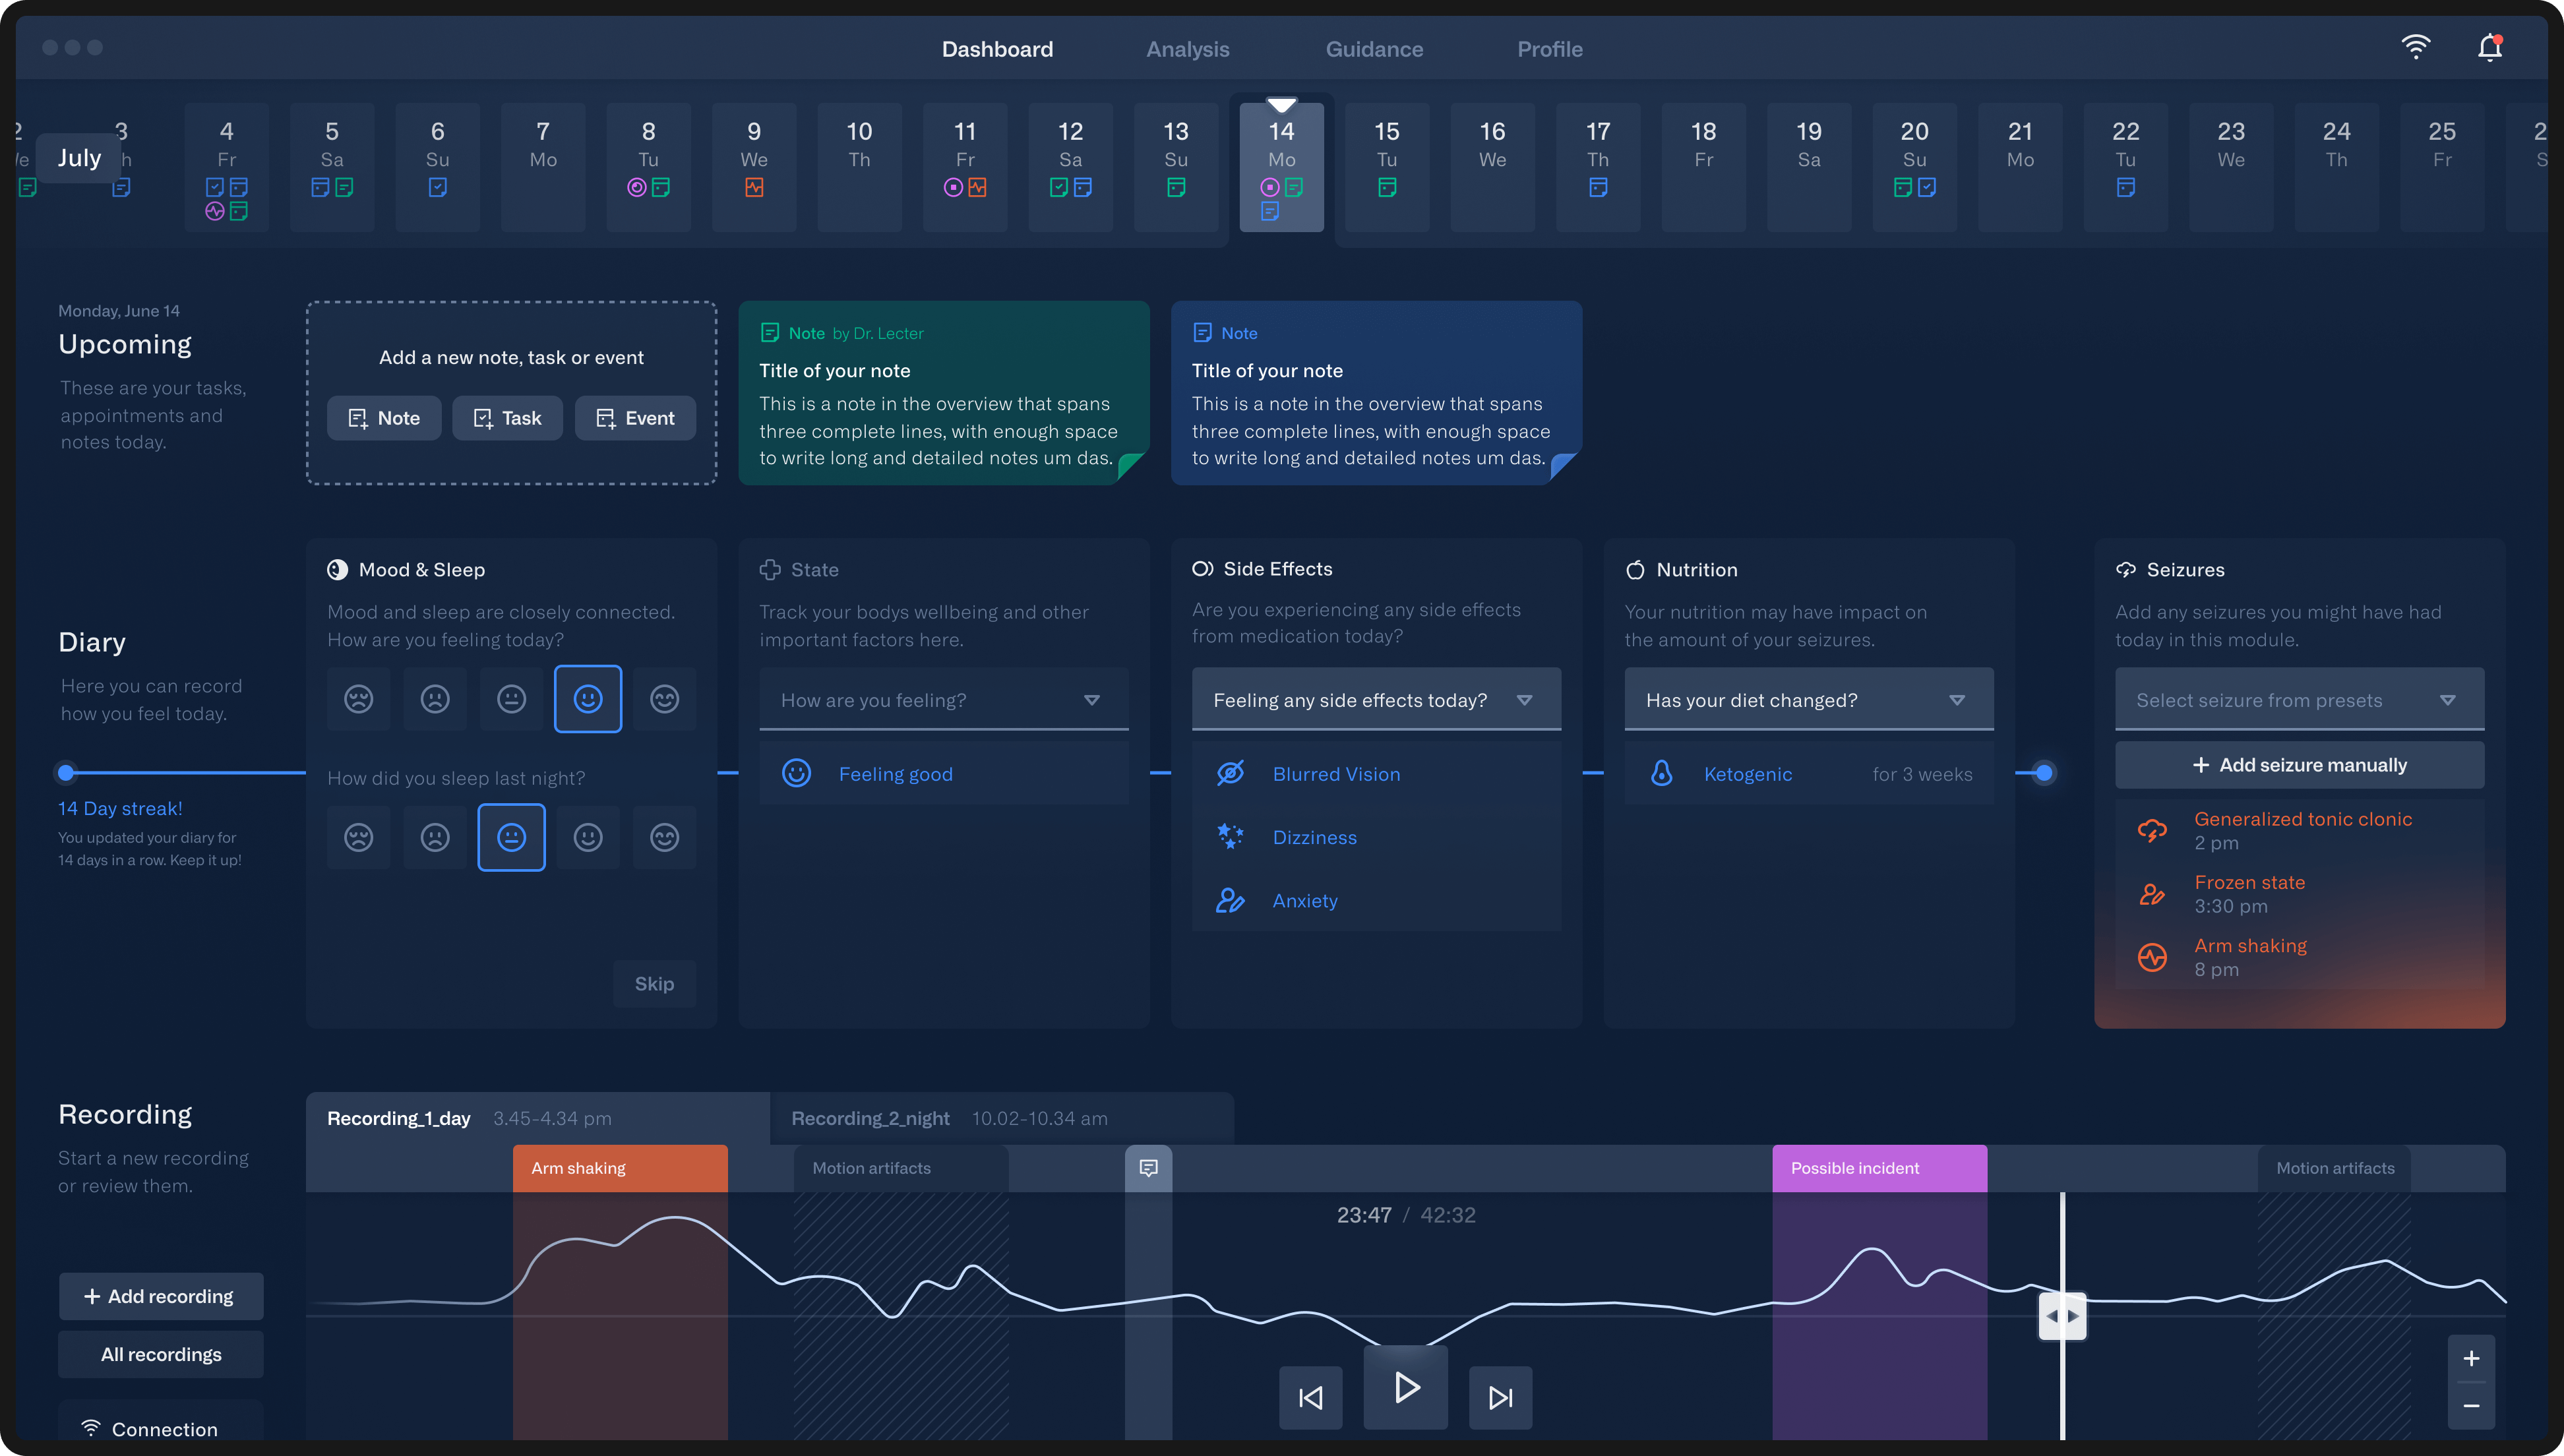
The software can only be operated with an access code provided by the attending physician. During a brief onboarding, the user adds his electronic patient records and the treating neurologist, followed by an introduction to the system. The process starts with the dashboard.
Calendar
The calendar is located underneath the taskbar. When starting the application, users automatically land on the current day. By selecting another date, the content of the dashboard adapts according to this day. For a quicker overview, color-coded icons indicate entries for each date.

Upcoming - notes, tasks and events
Users can add notes, tasks or time-limited events for the respective day (blue). In addition, the doctor's notes/tasks/events for the patient are displayed (presented in green). Each note type is also shown in the calendar with its own icon and matching color.
Diary
The epilepsy diary should at best be maintained everyday. Each card covers a topic relevant to the condition. Users can either select suggestions from a list or make their own entries. To encourage users to complete the diary, a blue progress bar fills up underneath the cards after each entry.
Seizure
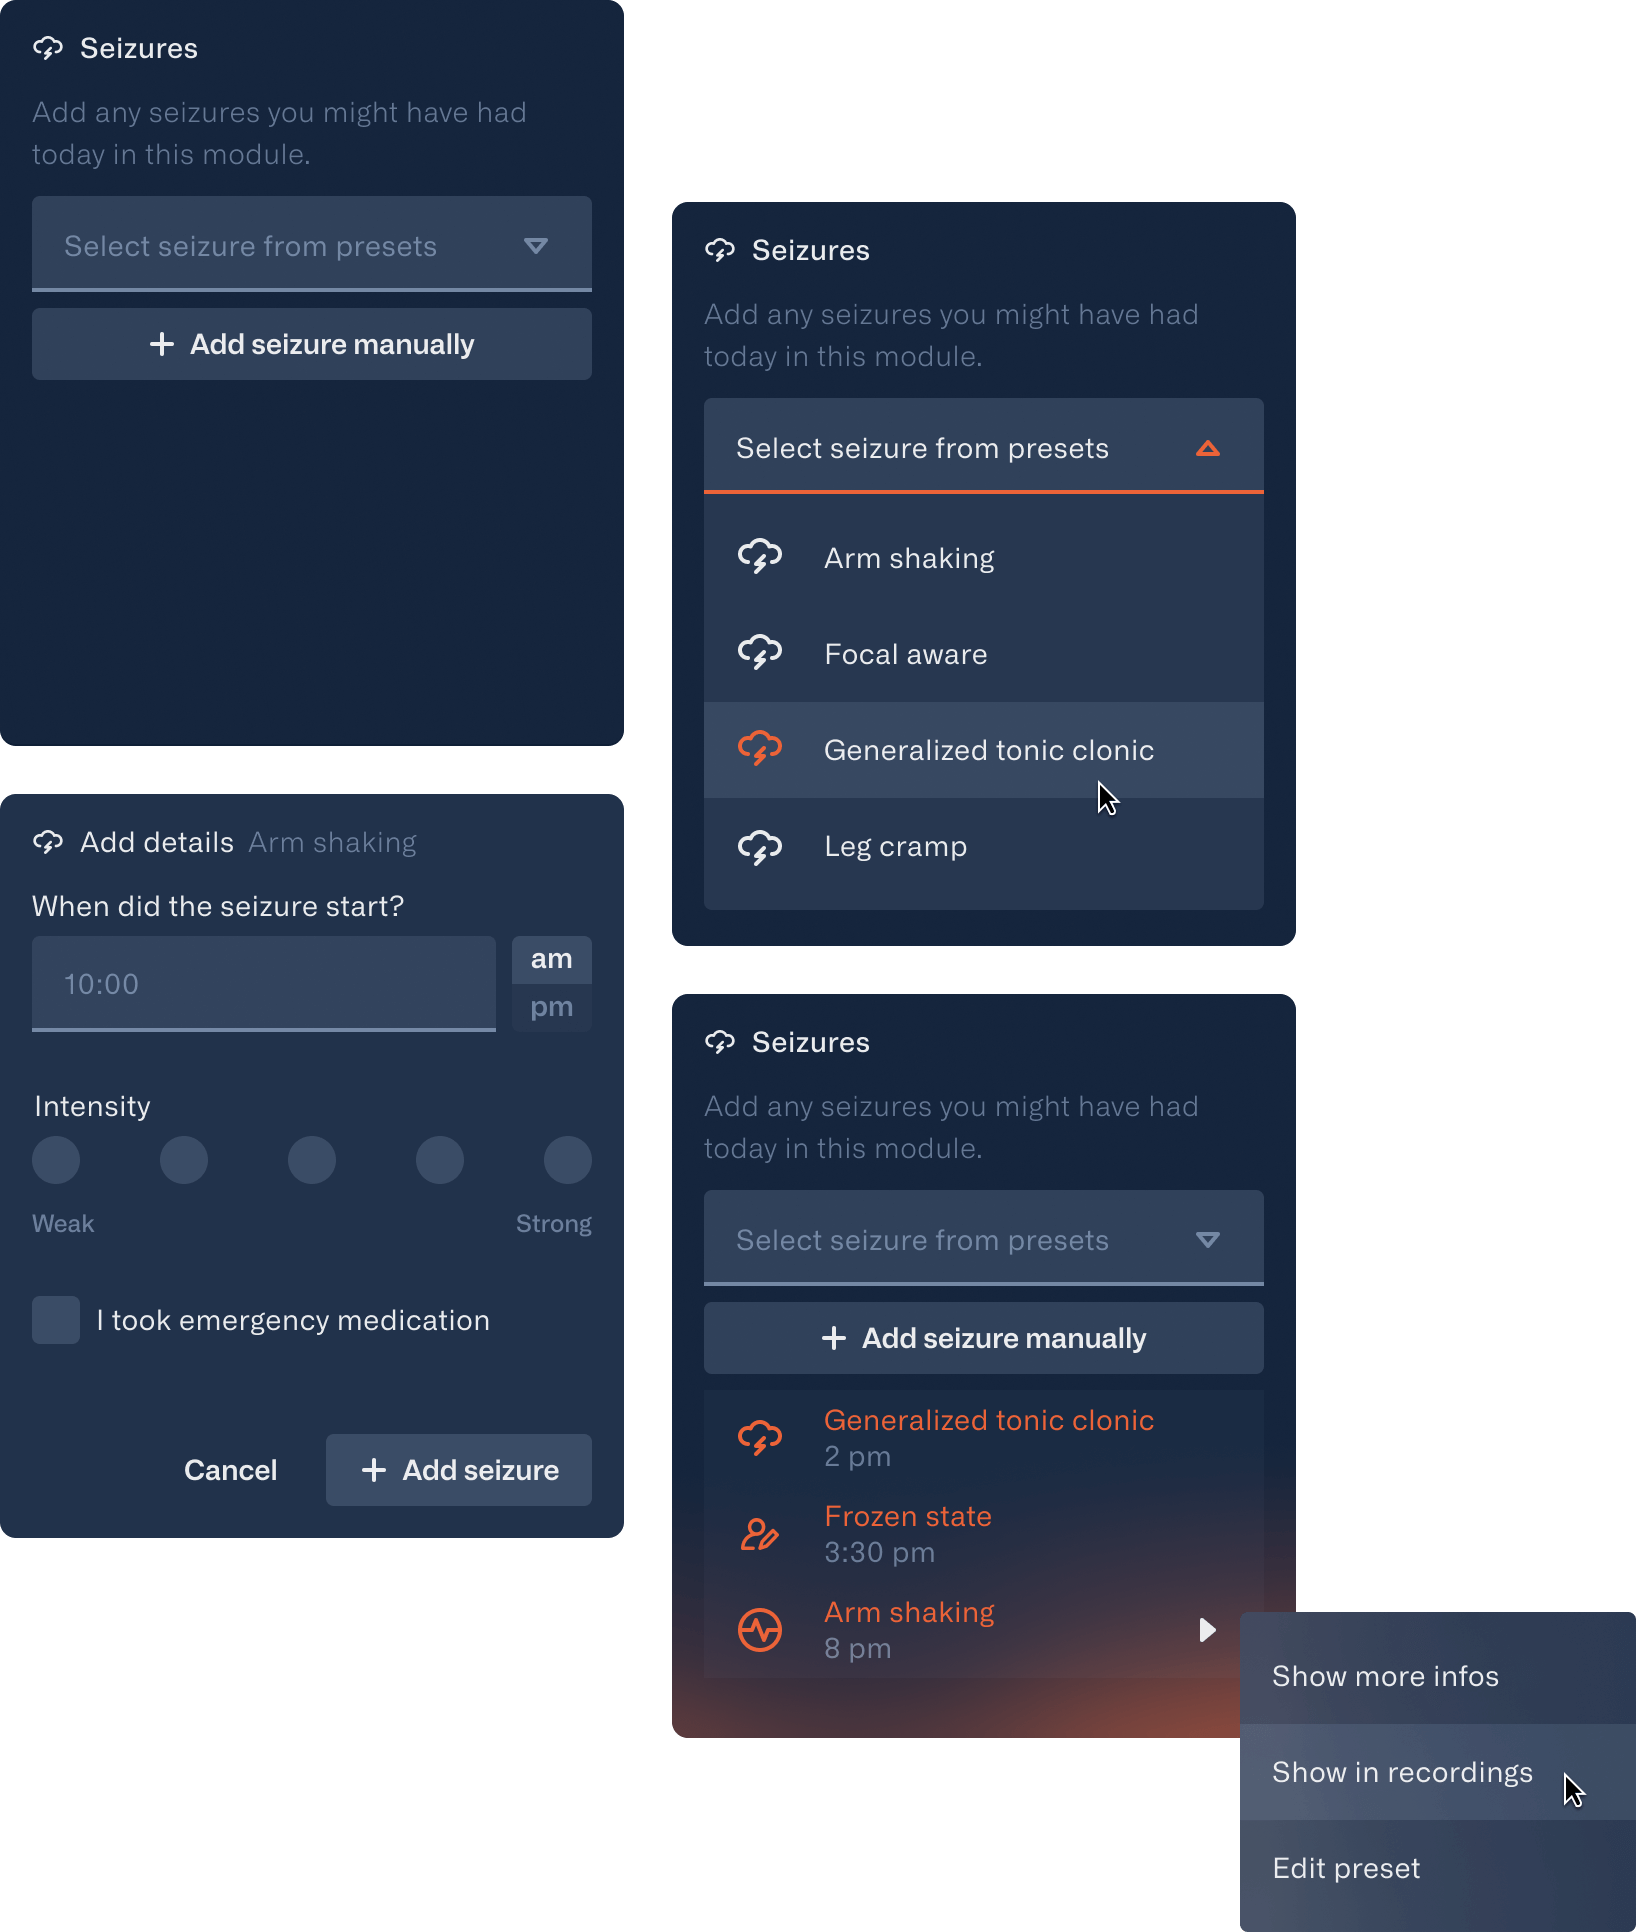
The seizure card is meant to document epileptic seizures that occurred during the day. Since seizures are often similar in their characteristics, it is possible to select from seizure presets that can be managed in the profile. However, it is also possible to document a seizure manually if it does not correspond to a preset. In addition, seizures that were detected during an EEG recording are also listed here.
Recording
The timeline shows EEG recordings in a compact and comprehensible way. A tab bar allows the user to select from different recordings of each day. Via machine learning, abnormal activities (pink) and motion artifacts are automatically highlited and shown as tags in the area below. Comments are also shown here. Possible incidents are only displayed as seizures (orange) once confirmed and assigned to a seizure type by the user.
For a more detailed view, the area underneath the timeline shows all eight electrode graphs individually. A new recording is started by clicking the button on the left. To avoid interferences in the recording, the connection status of each electrode is also displayed here, once the EEG device is mounted on the patients head.
Profile
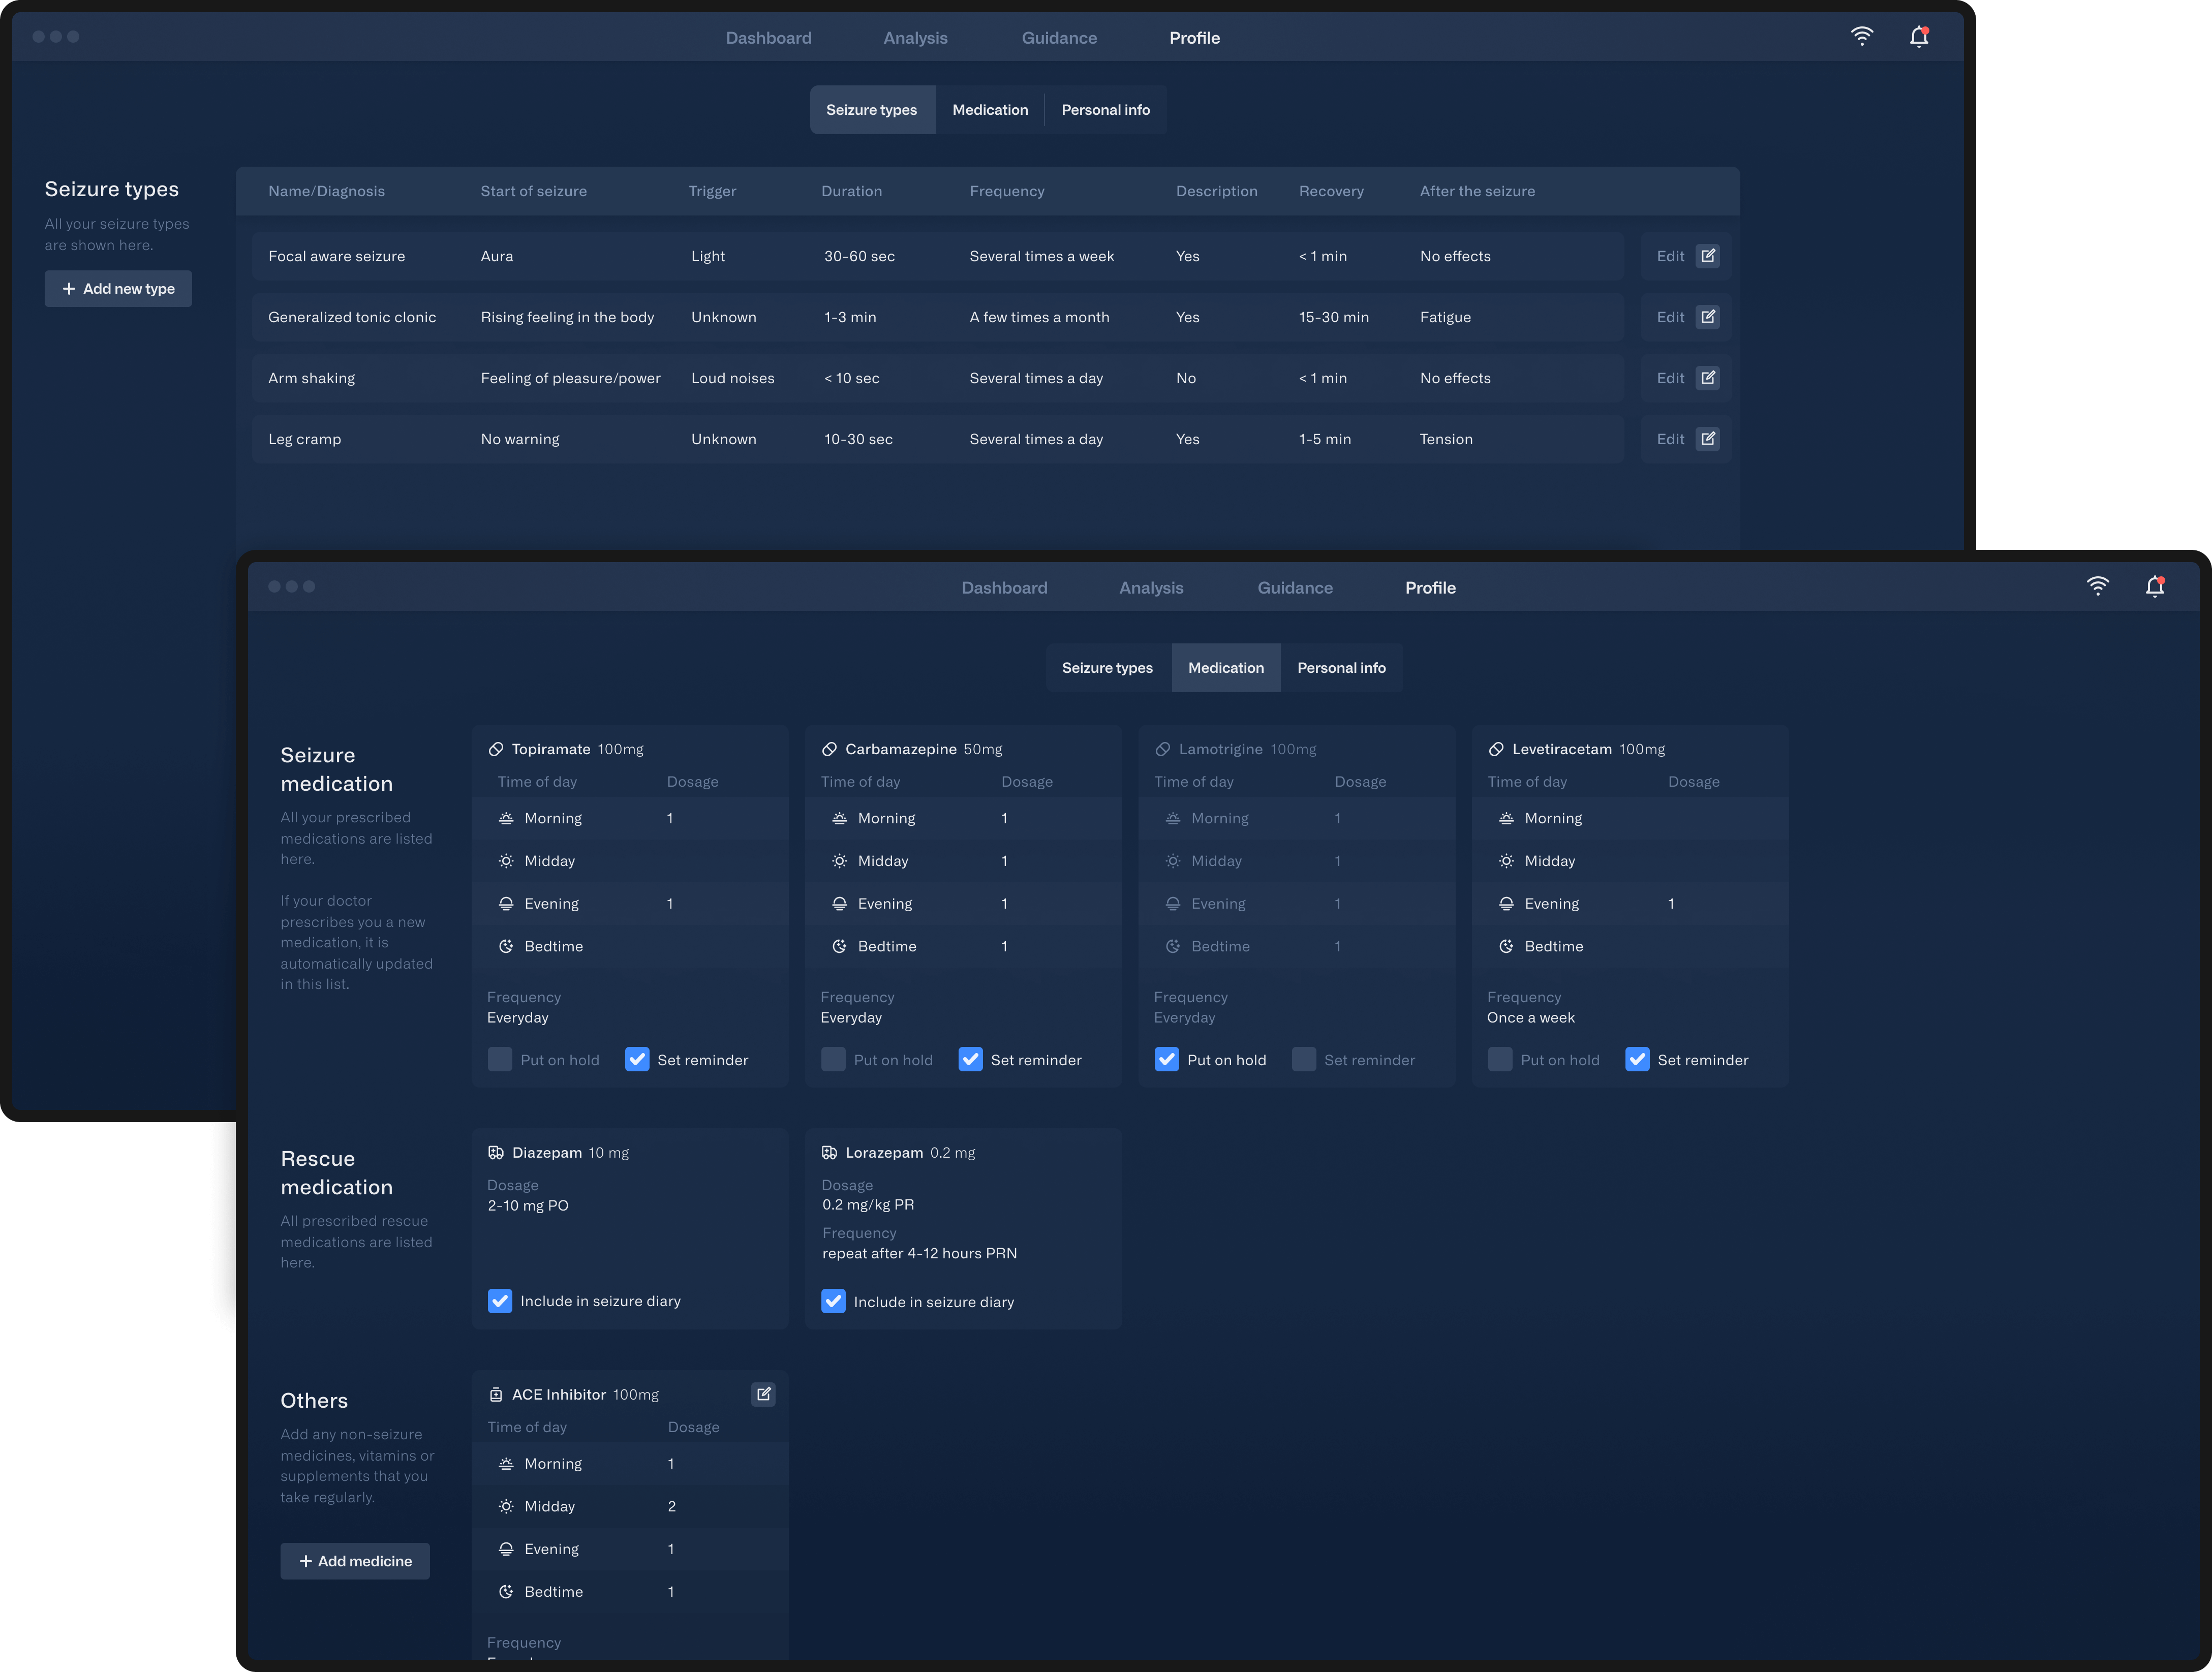
Besides personal information and presets of seizure types, prescribed medications can also be viewed and managed in the profile. Prescription drugs are added automatically. However, if the intake is paused medication-cards can be put on hold individually to no longer receive reminders.
Add medicine/seizure type
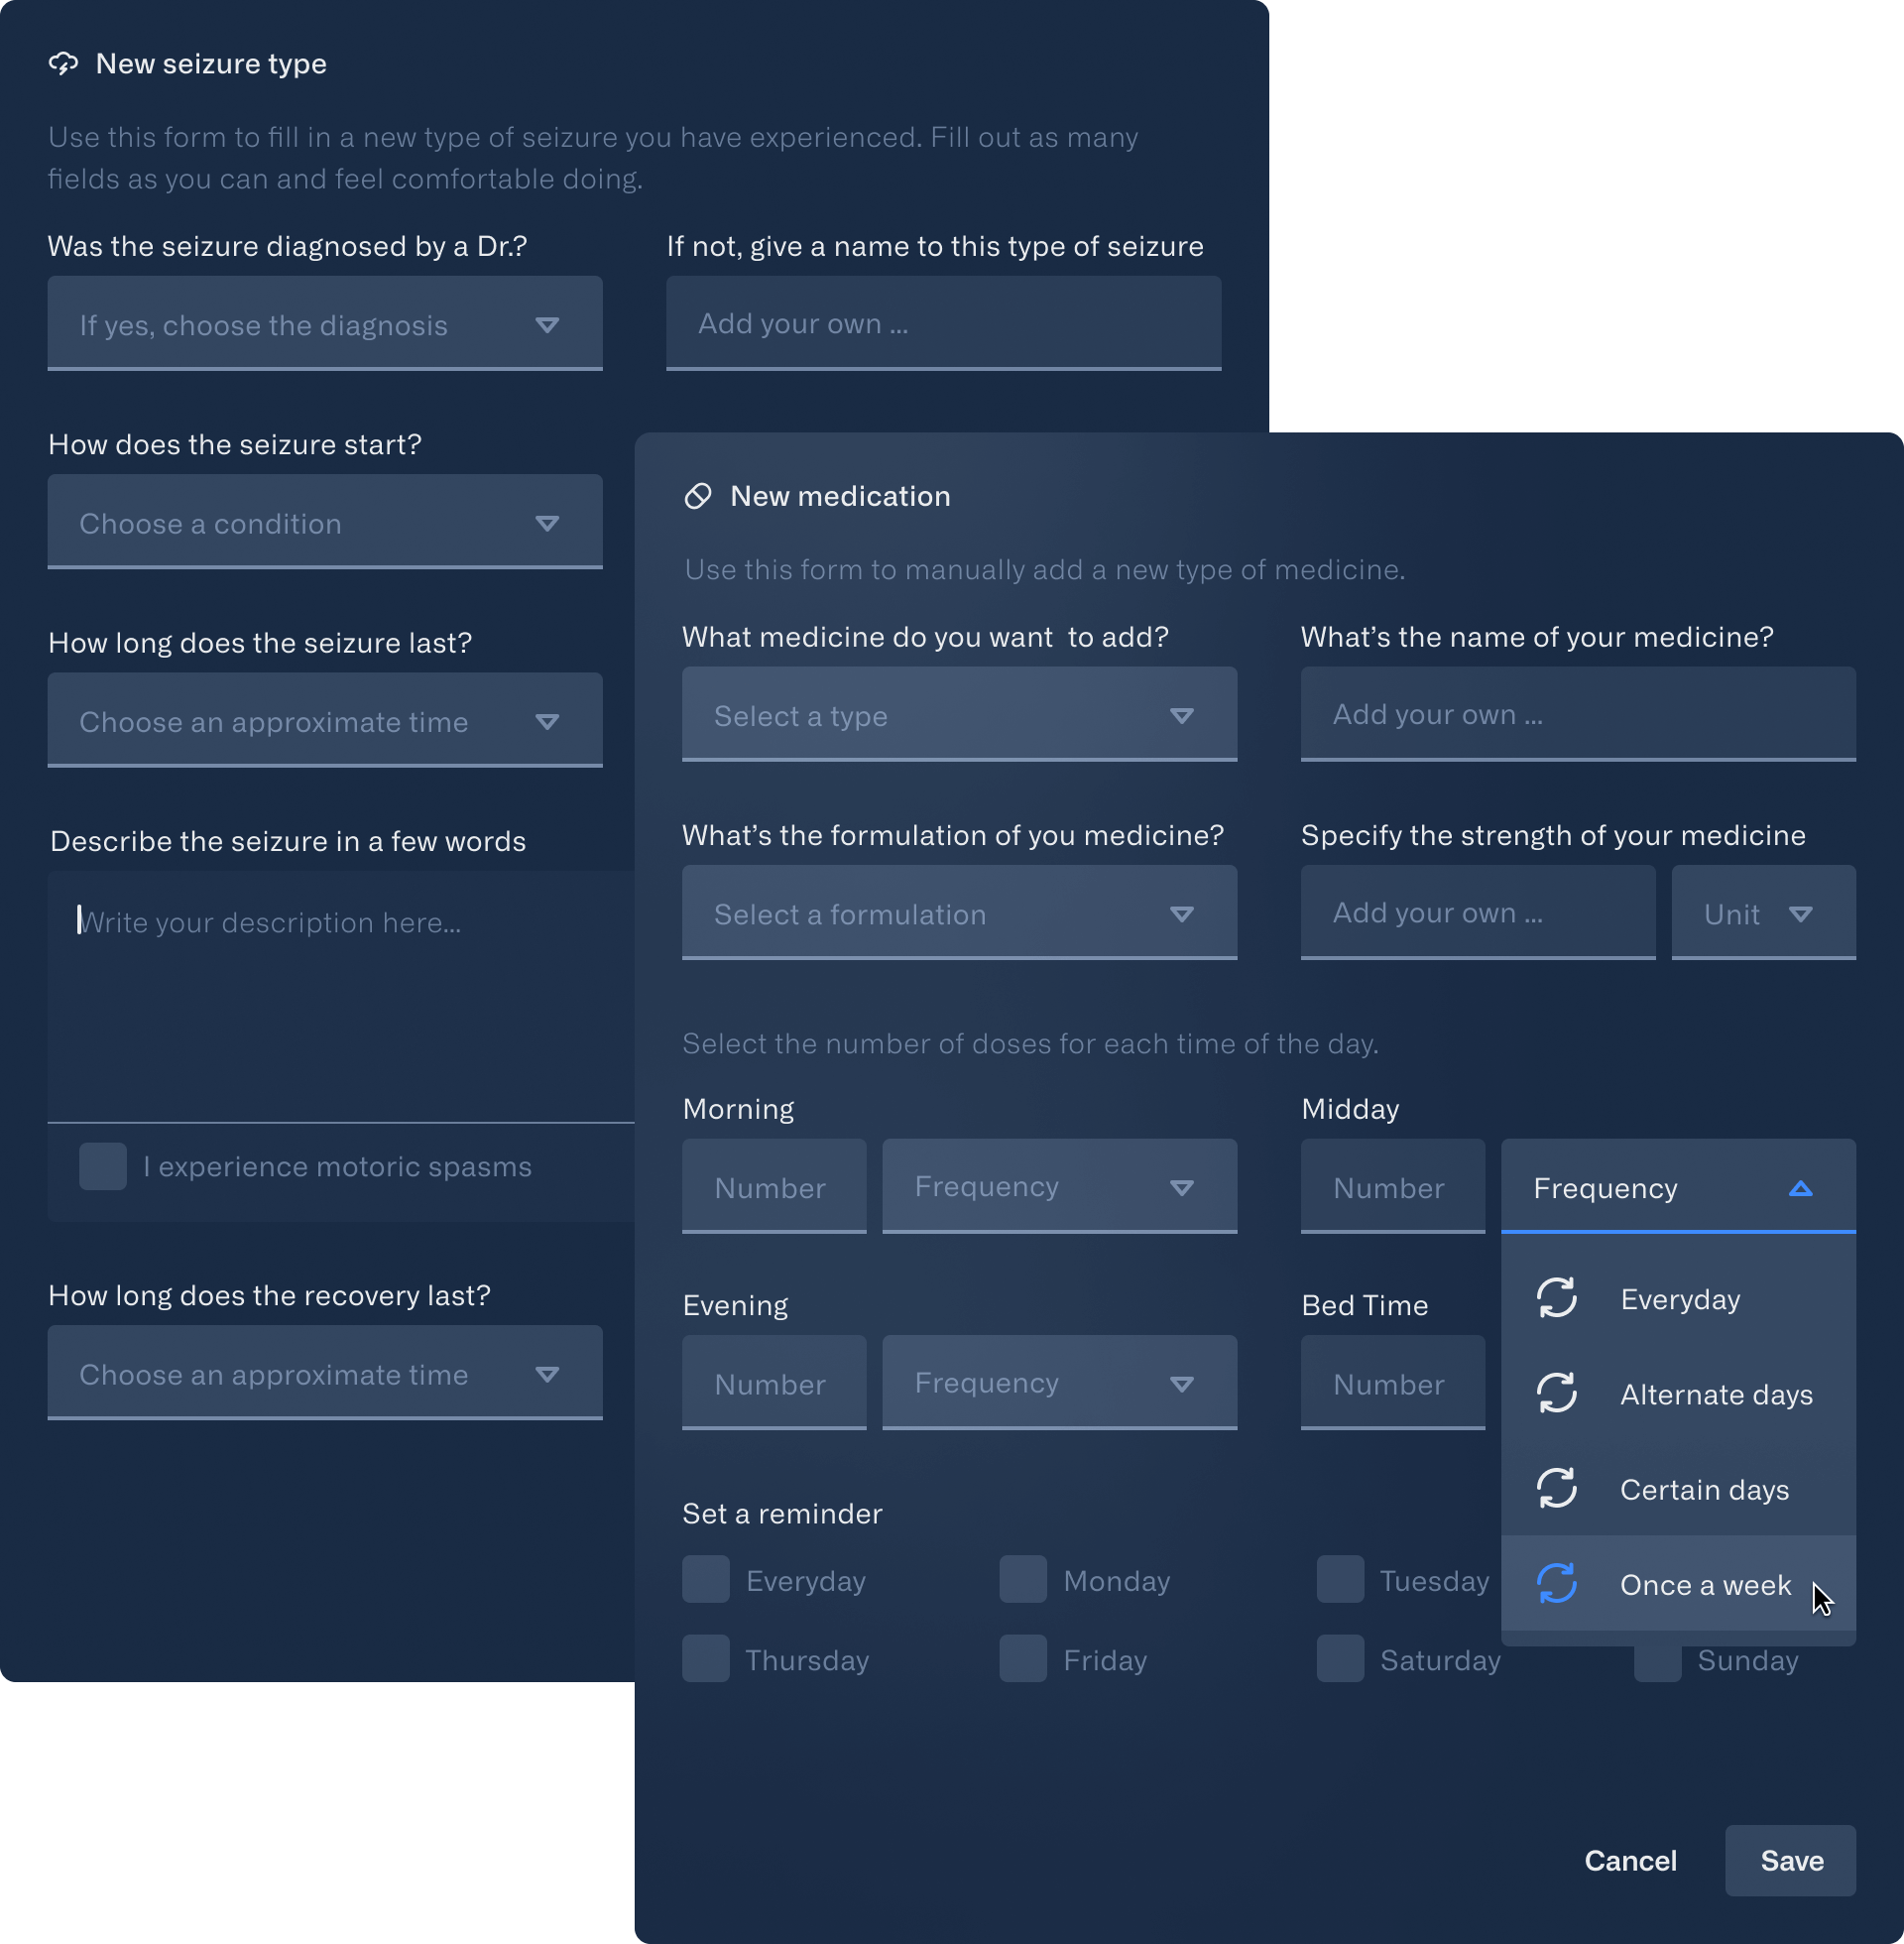
Presets help to make the use of the application as automated and time-saving as possible. By categorizing types of incidents as detailed as possible, it is not necessary to document each incident manually.
Analysis
All data, whether EEG recordings or diary entries, are summarized and compared in the analysis tab. Since the frequency and intensity of epileptic seizures depend on many factors, an individual treatment plan must be developed for each patient. The right diet, sleep rythm or medication can have a positive influence on the course of the condition.
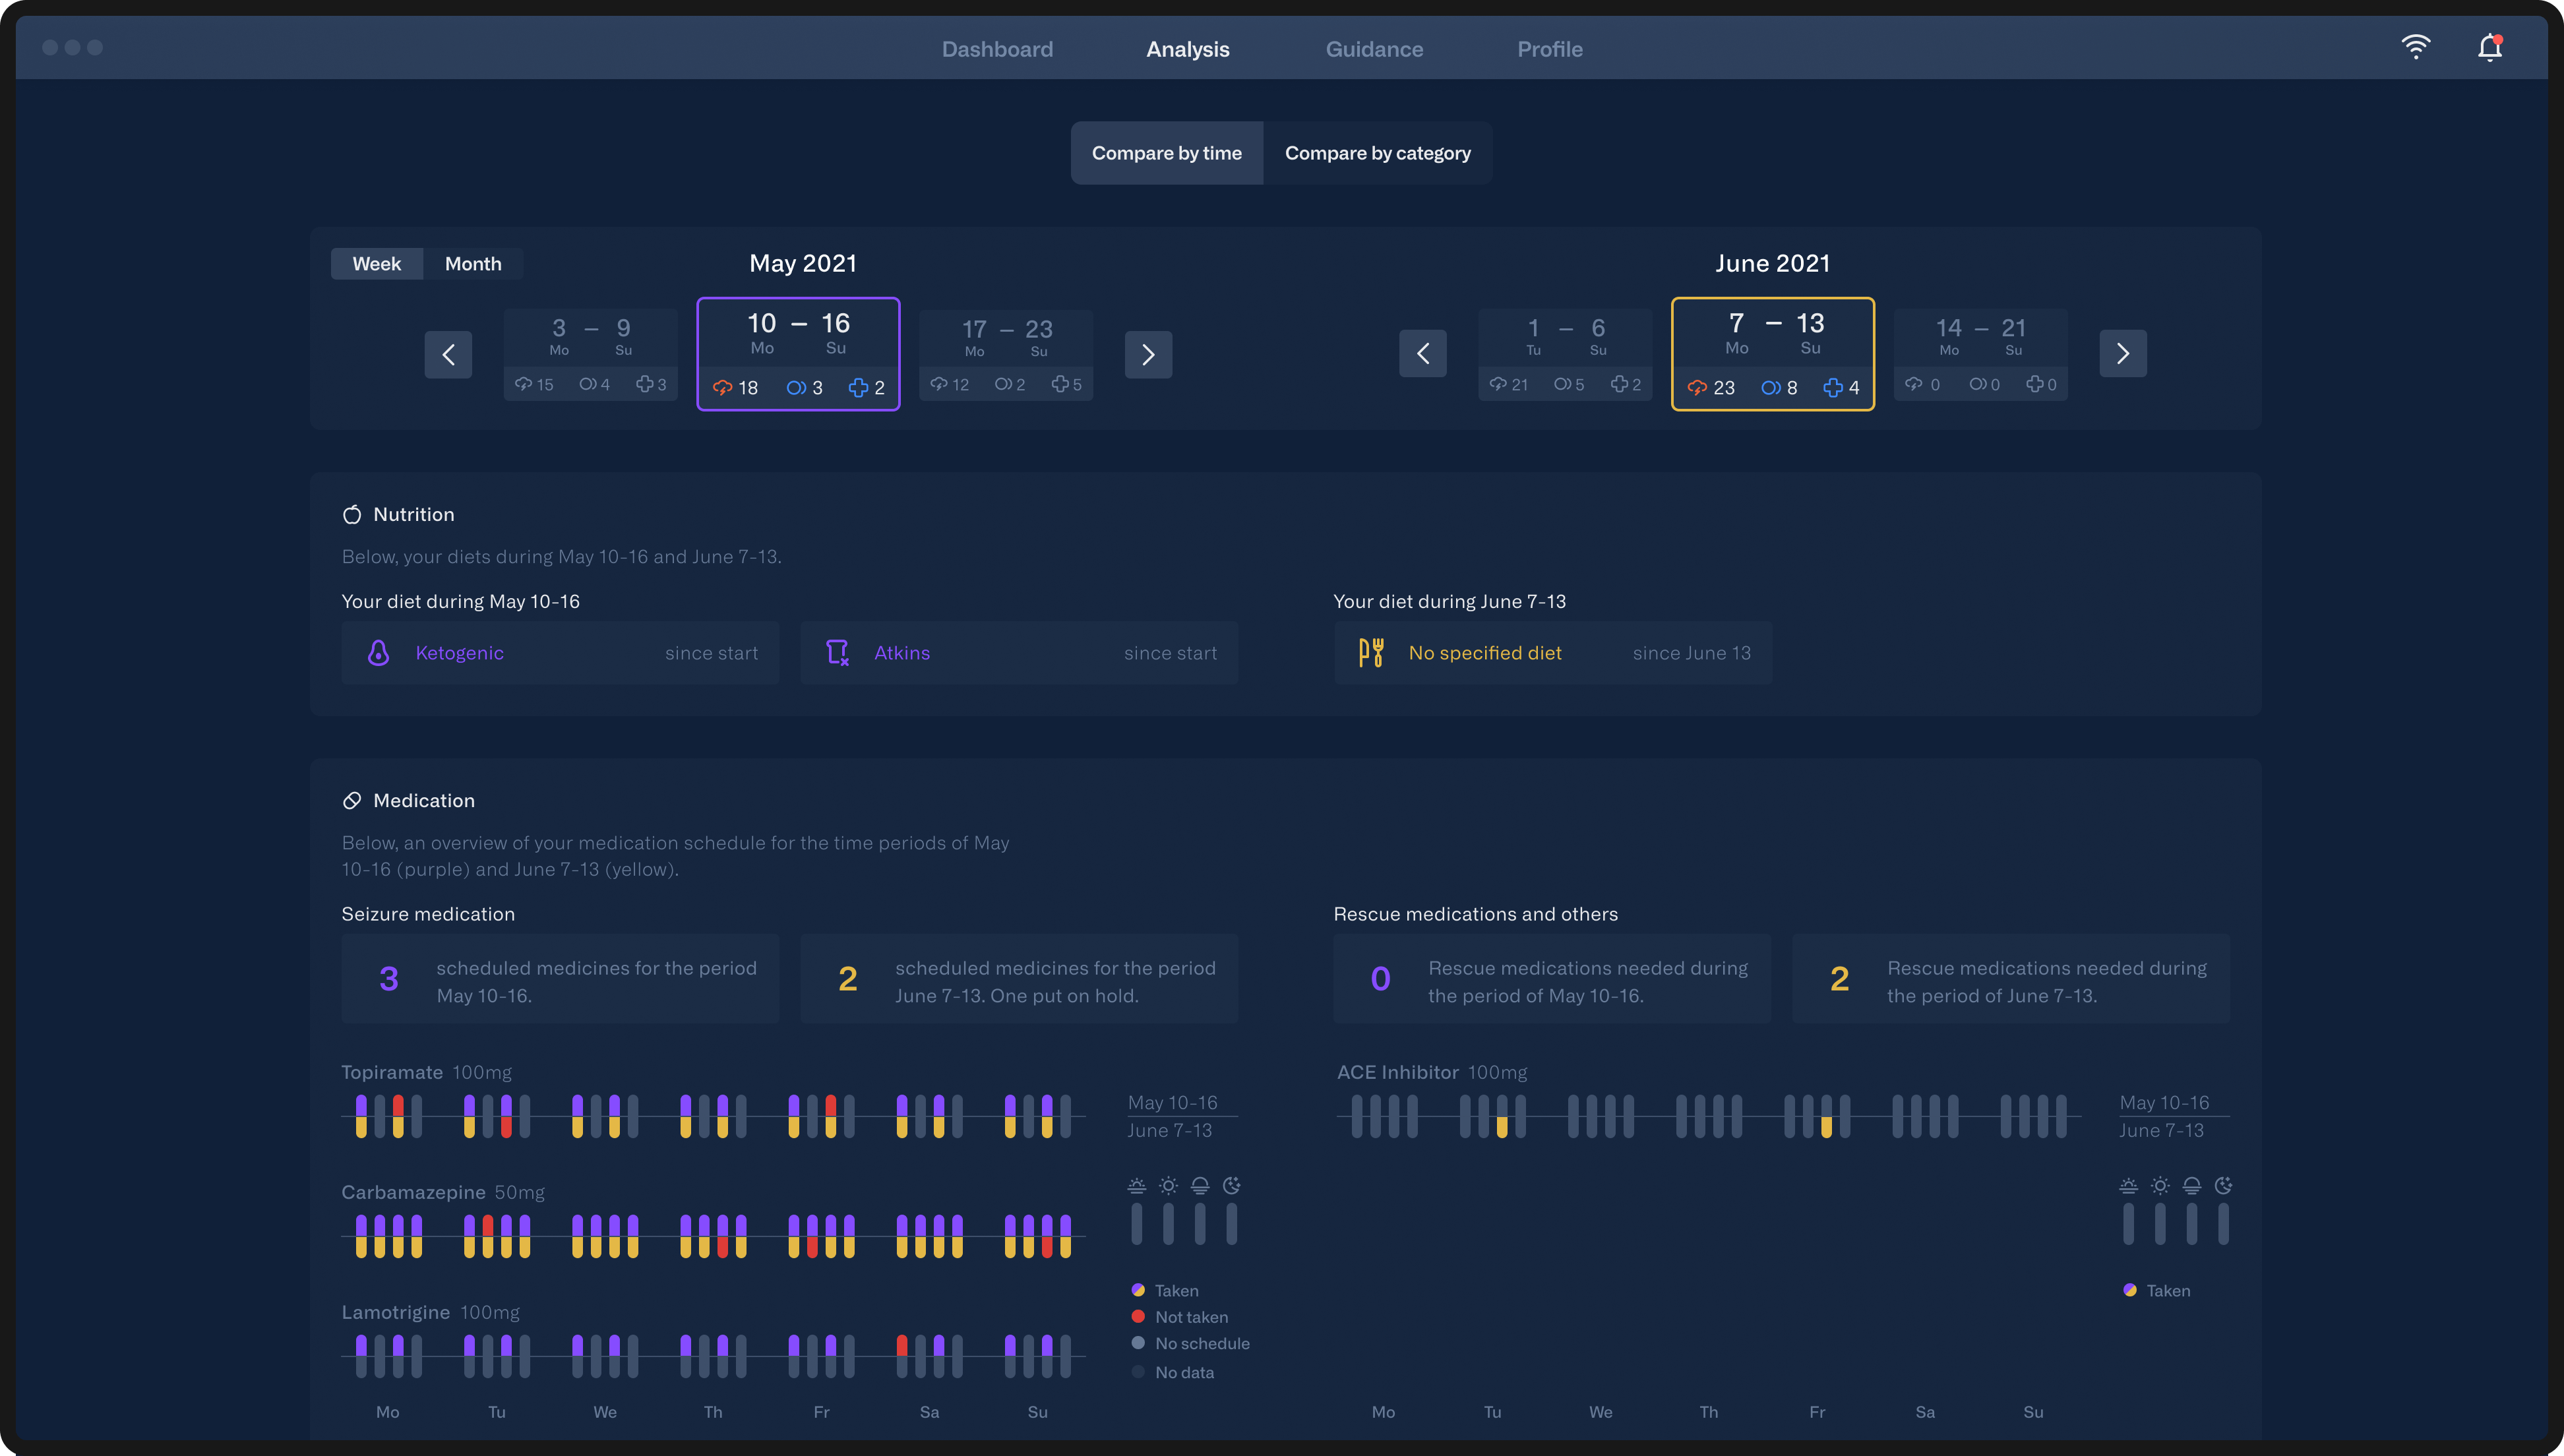
Analysis by time
Users have the opportunity to compare their well-being and effects on their body during different periods of time. Each data card has the same structure: A short explanatory text followed by the summarized results of the comparison and a detailed data visualization.
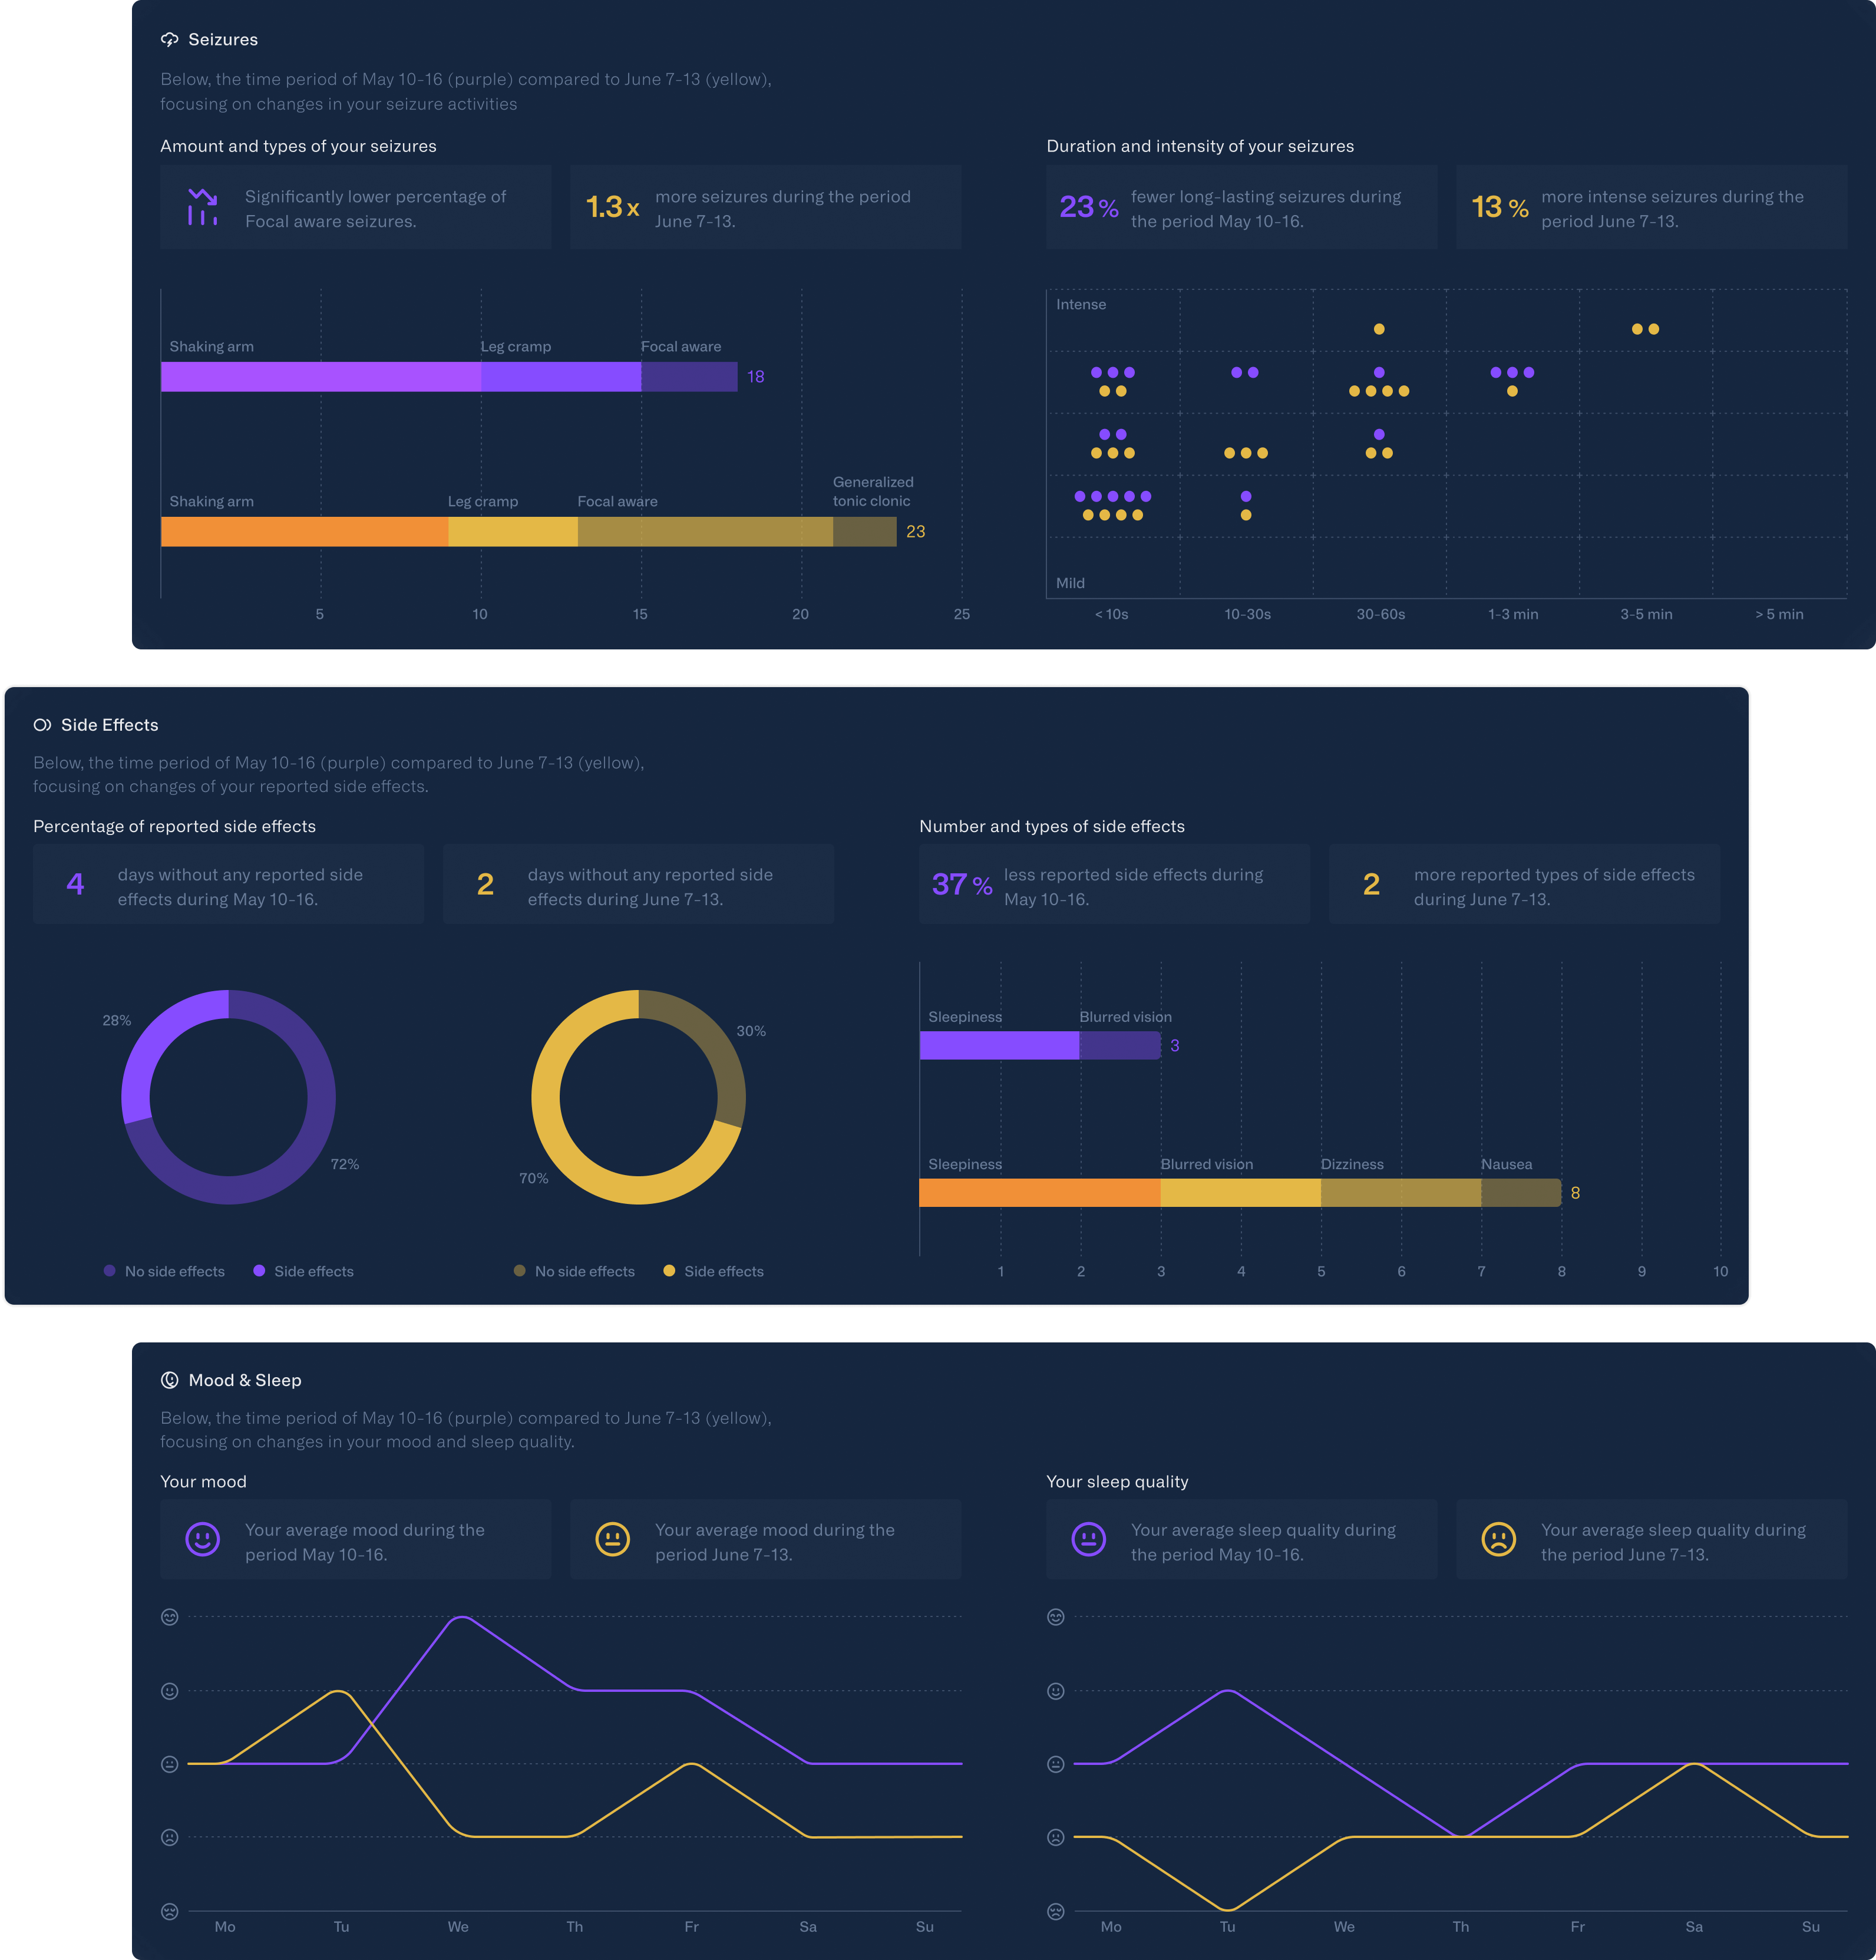
Analysis by category
The comparison by category follows a similar principle. However, in this case, the users specifically compare two medicines or diets and what effects they had on their wellbeing. Meaning, that all data collected while being on the one diet is compared to those days where the other diet took place. This can help determine the best diet/medicine for a patient.
Doctors dashboard
To relieve not only epilepsy patients during treatment, but also the attending physician, we implemented a separate access to the software. Once logged in, a list of all patients and their latest activities is displayed. To avoid information overload, the doctor has the option to customize notifications for each patient as needed.
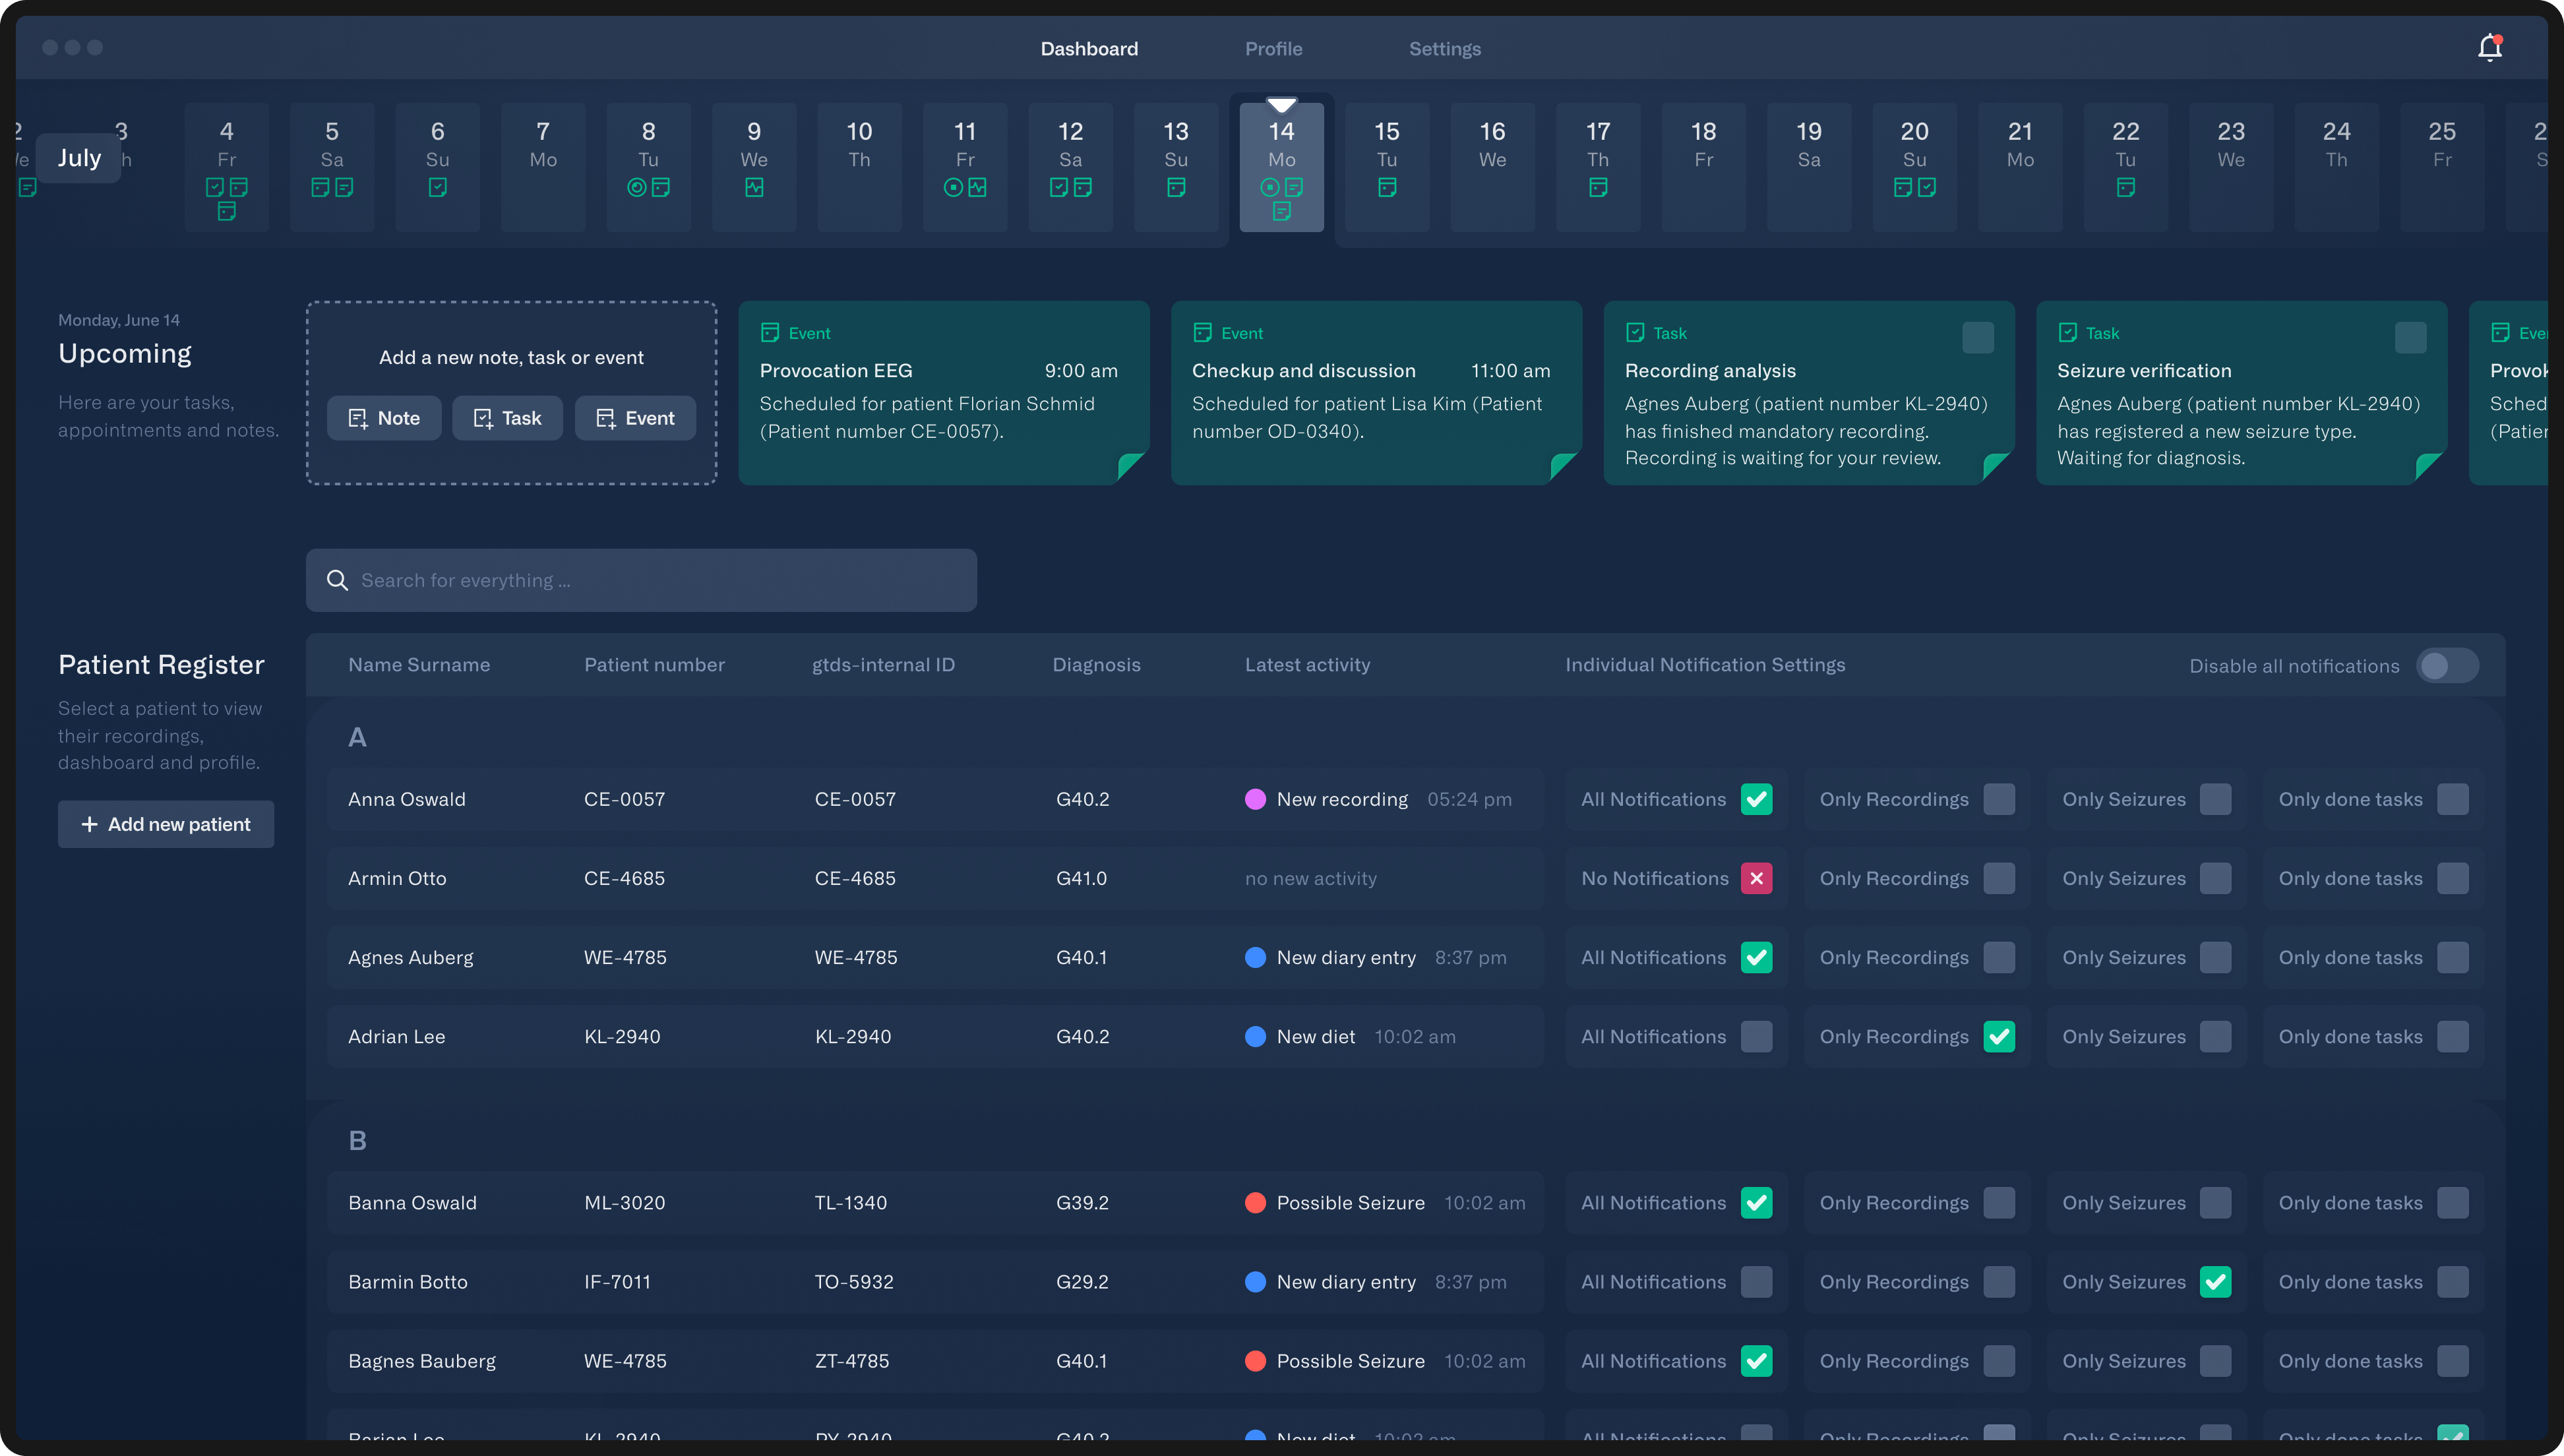
Patient dashboard
By clicking on a name, the doctor is redirected to the dashboard of that patient. The calendar has the same functionality as shown on the patients dashboard. Icons point out the most important events of a day. Notes, tasks or appointments for the patient can be added in the overview - displayed in green. The diary provides the doctor with all the important information about the physical condition on that day.
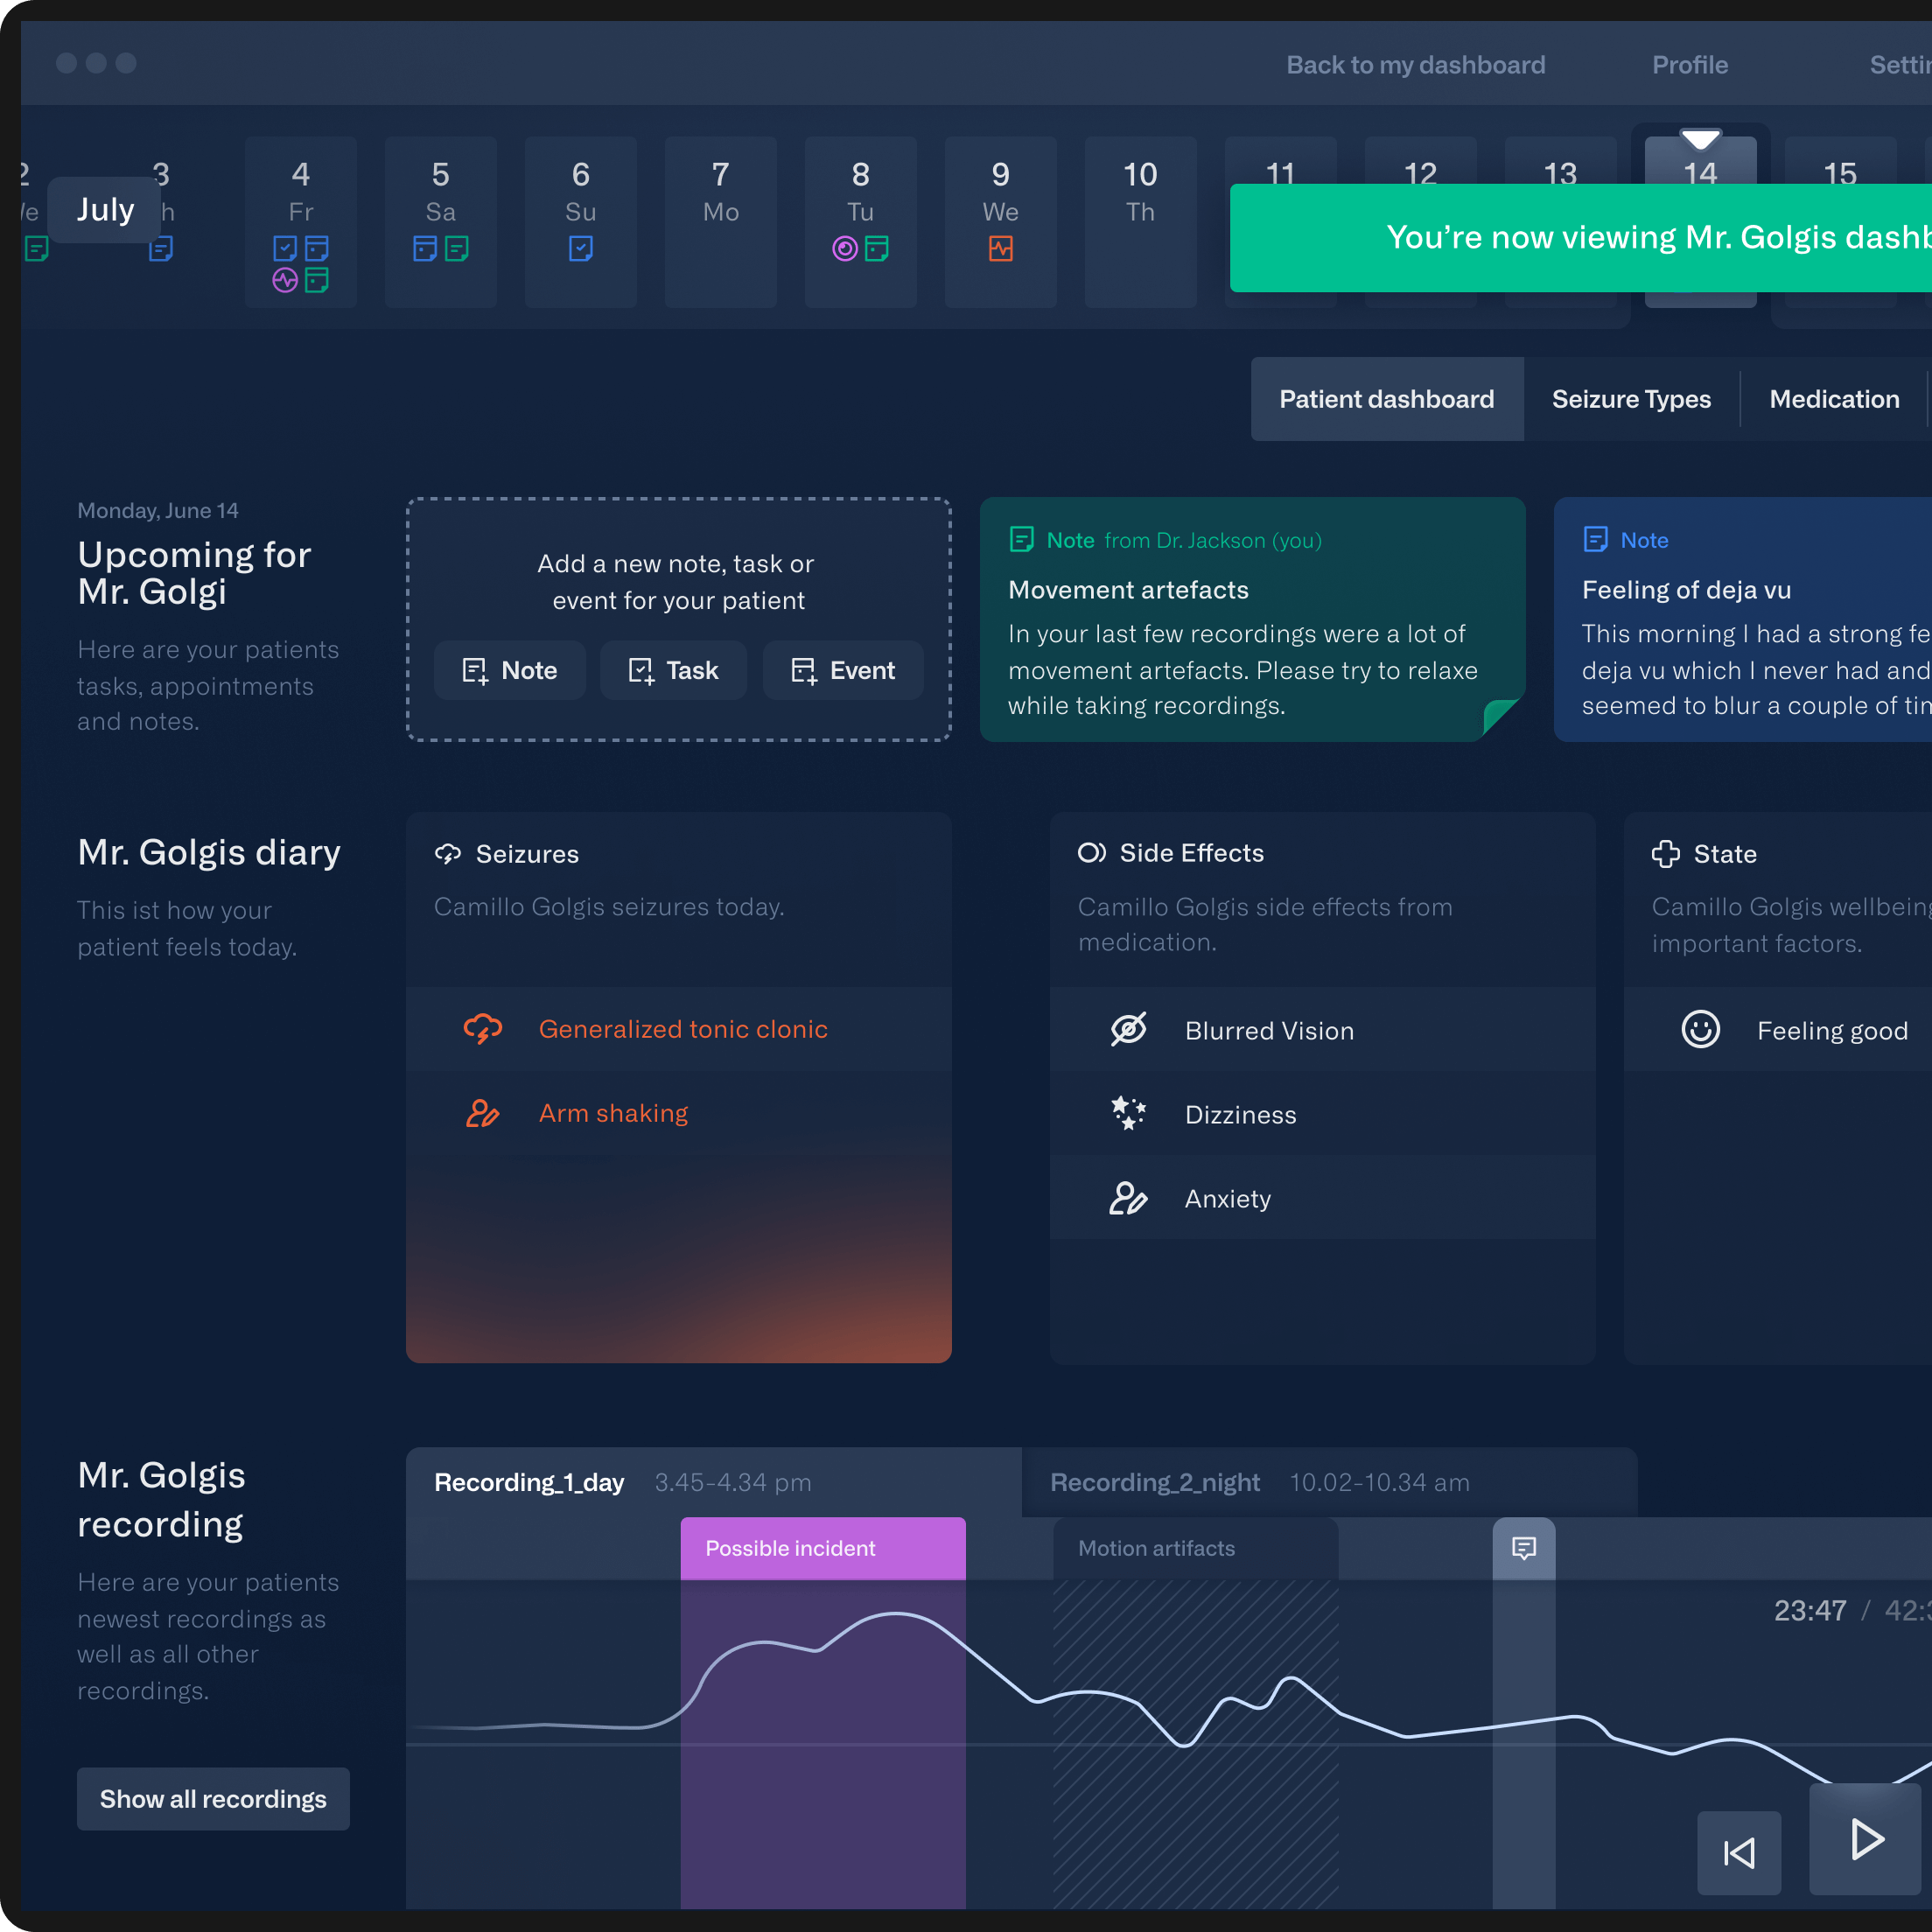
EEG recording
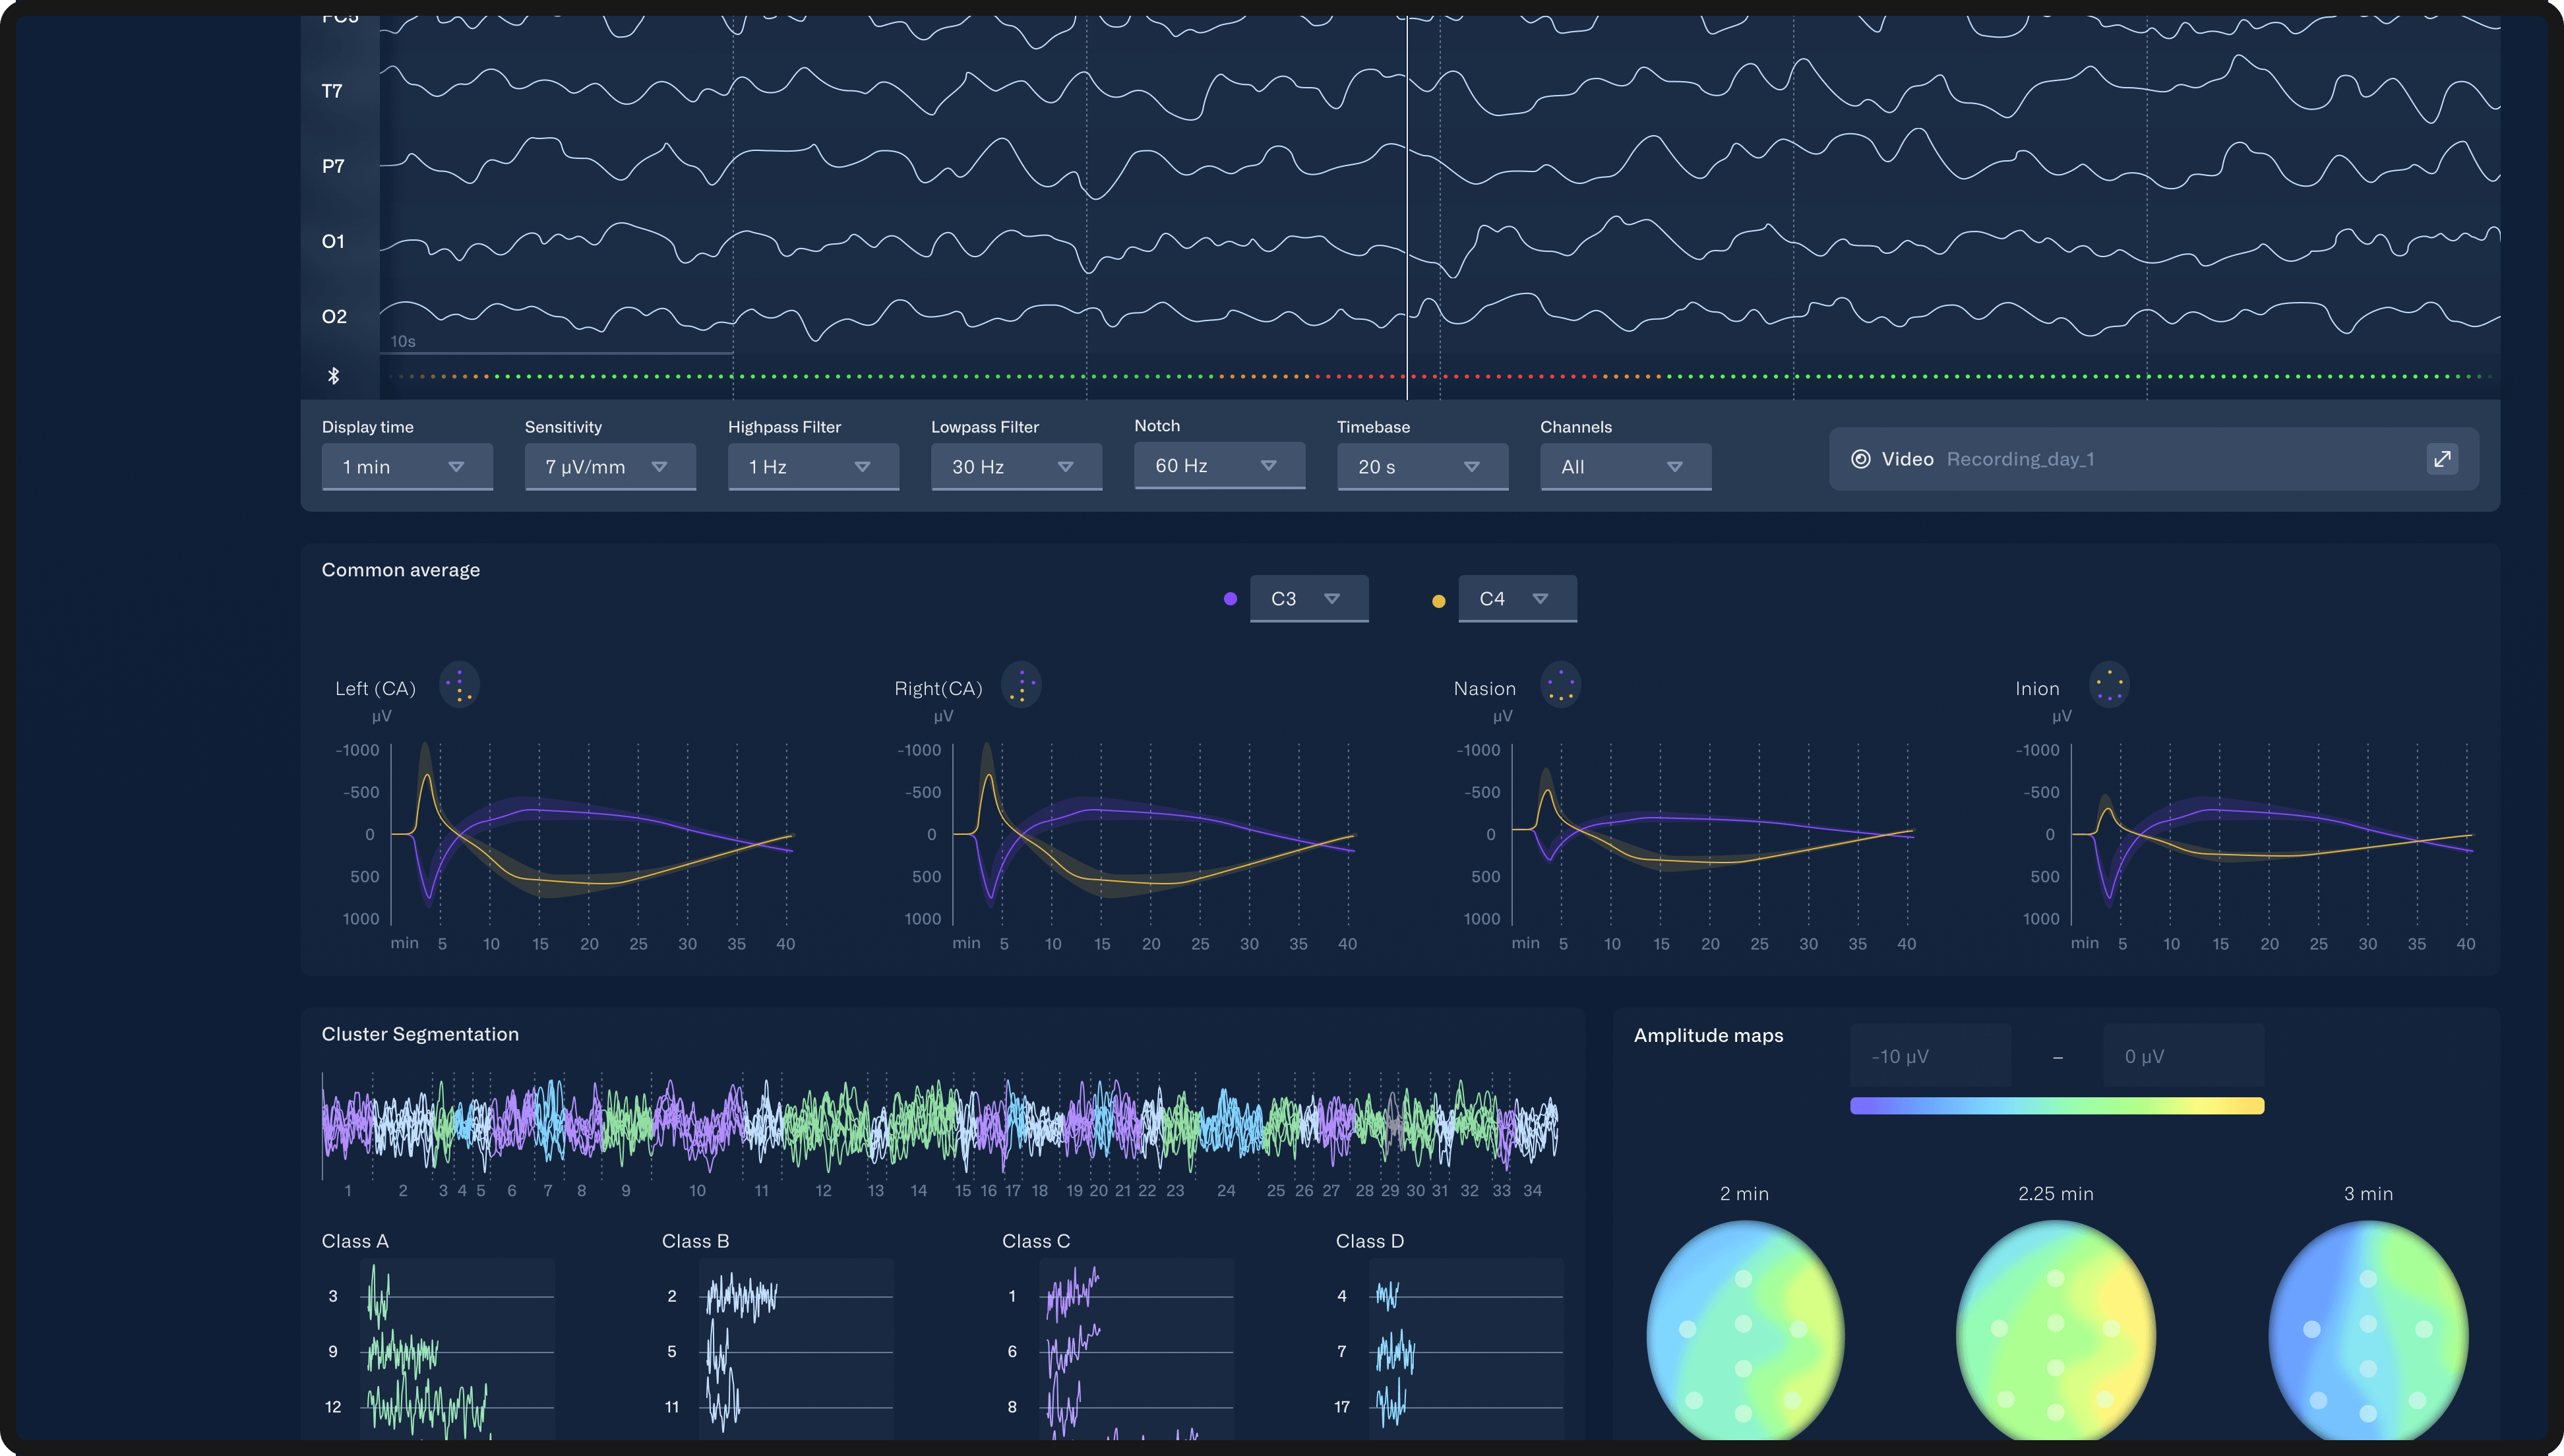
The most interesting part for the doctor is probably the EEG recordings. The timeline remains unchanged. What's new is the detailed evaluation of the recordings below.
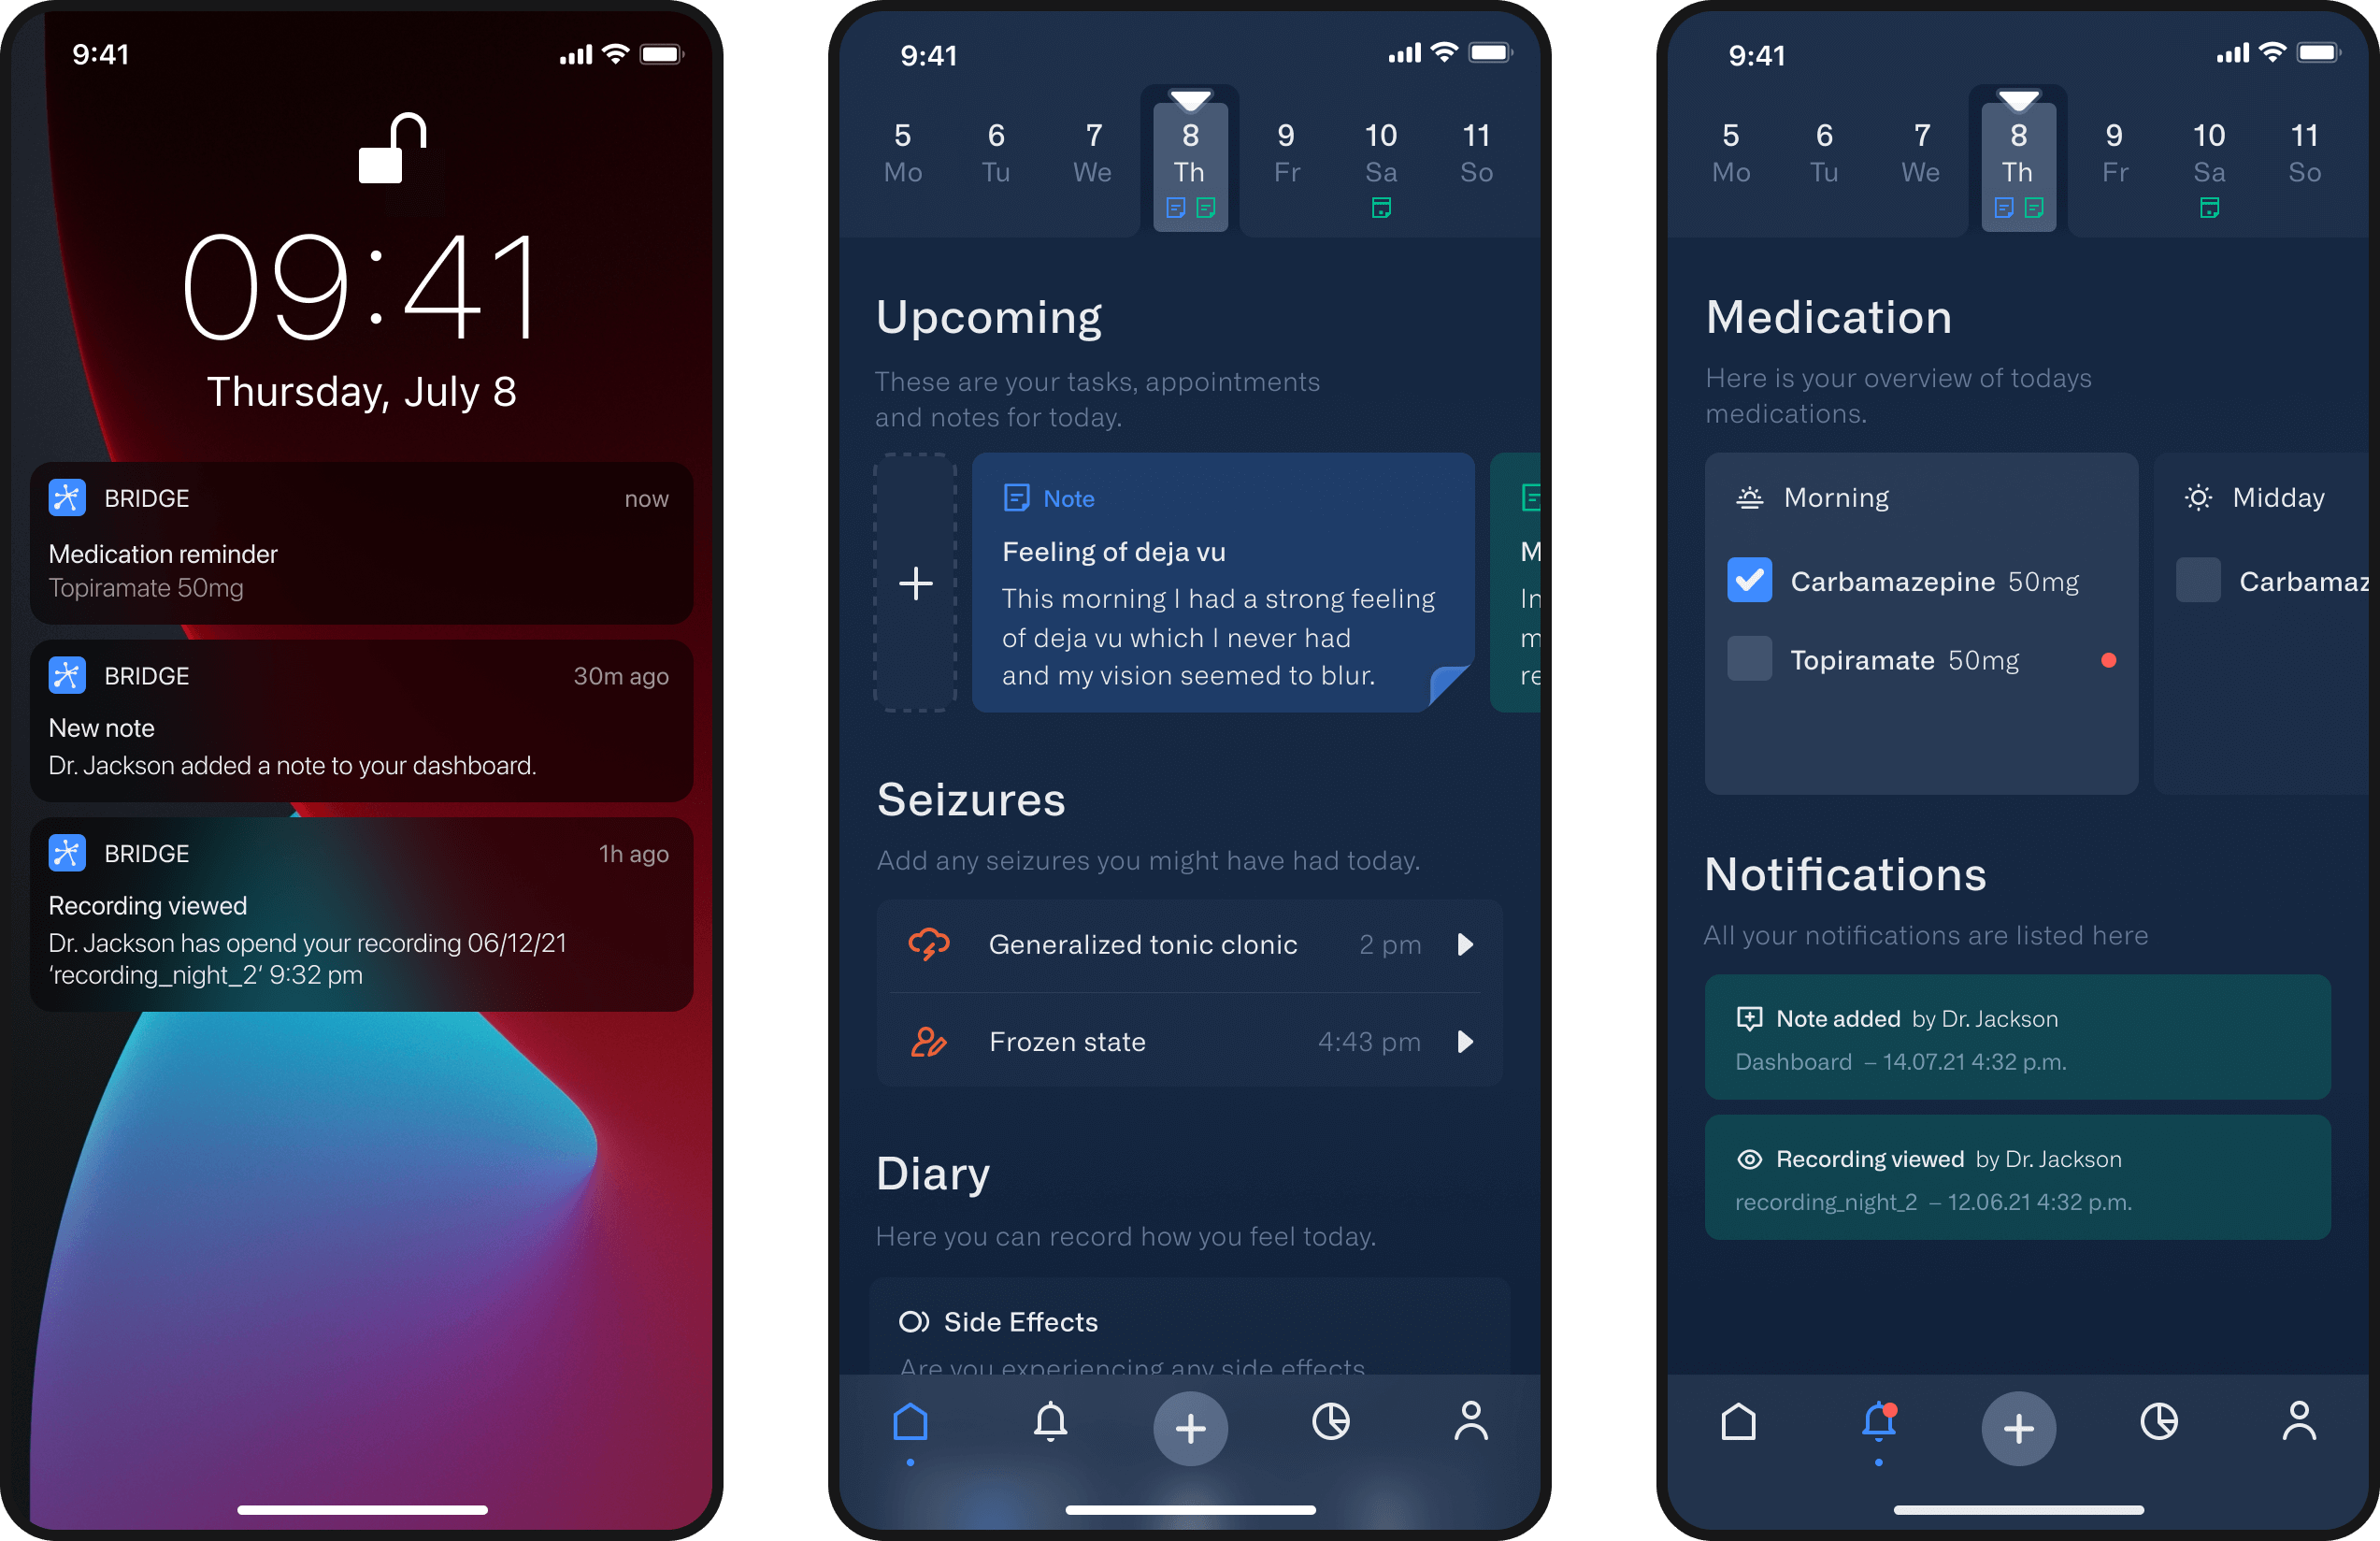
Smartphone app
Due to time constraints, we were focusing on the desktop application. Smartphones are best suited for reminders or to record seizures or diary entries. For this reason, we wanted to give at least a glimpse of the app. It comes with the same functionalities as the desktop application. For viewing the EEG recordings or evaluating the analysis part, a larger screen is recommended though.
